PSYB04H3 Lecture Notes - Lecture 10: Standard Deviation, Frequency Distribution, Central Tendency


PSYB04
LEC 10
STATISTICS REVIEW - Descriptive Statistics
Describing Data
● When researcher collects data from group of ppl it’s often a sample from a larger pop
● Researchers don’t always study a sample from a larger pop
● Variables → what researchers measure or manipulate in a study
○ Take on different levels or values for diff members of a sample
→ Data Matrices
● After collecting data usually enter the data in a grid format (data matrix) using computer program
● Each column represents a variable
● Each row represents a case (person, animal, state, price, etc)
→ Frequency Distributions and Stemplots
● Techniques for organizing column of data in a data matrix
●
Frequency distribution →
table that gives a visual picture of the observation of a particular variable
○ Order the scores
○ Shows how many of the cases scores each possible value on the variable
● Based on data from frequency distribution create a graph → frequency histogram
● Another option for organizing data visually is a graphical representation → stemplot aka stem
and leaf plot
○ Values of the left of the line = stems
○ Values on the right = leaves
○ First determine the units for the stems → tens, hundreds, thousands
■ Use most appropriate level for the data
○ Then enter the leaves → represent each individual score
○ Useful because it’s a table and graph at the same time
○ Simple to see all the scores
→ Describing Central Tendencies (Mode, Median, and Mean)
●
Central tendency →
measure of what value the individual scores tend to center on
● Mode
○ Value of the most common score
○ Score that was received by more members of the group than any other
○
bimodal→
having two modes or scores
○
Multimodal →
having more than two moes or scores
● Median
○ Value at the middlemost score of a distribution of scores
○ Score that divides a frequency distribution into halves
find more resources at oneclass.com
find more resources at oneclass.com

● Mean
○ Average
○ Found by adding all the scores in the batch then dividing by the number of scores
● Mean, Median, Mode: Which to Use?
○ Mean is most common measure of central tendency
○ When a set of scores contains a few extreme scores on one end (outliers) the median or
mode may be more accurate measure of central tendency
→ Describing Variability (Variance and Standard Deviation)
● We can also describe how spread out the scores are
● Two most common descriptive techniques that capture relative spread of scores are variance and
standard deviation
●
Variance→
quantifies how spread out the scores of a sample are around their mean
○ Square of the standard deviation
●
Standard deviation →
captures how far, on average, each score in a data set is from the mean
● SD more commonly reported than the variance b/c it better captures how far, on average, each
score is from the mean
● When SD is large → great deal of variability in the set
● When SD is small → less variability
● In empirical journal article, mean and SD info usually presented either in Results section or as a
part of a table
→ Describing Relative Standing (z Scores)
●
Z scores →
describes whether an individual’s score is above or below the mean and how far it is
from the mean, in SD units
● Computing z Scores
○ Z = (X-M) / SD
■ X → individual score
■ M → mean
■ SD → standard deviation
○ Any score below the mean → (-) z score
○ Score above mean → (+) z score
○ Any score directly at the mean → z score of 0
● Using z scores
○ Z score lets us compare relative standing of individual cases on variables that might have
been measured in diff units
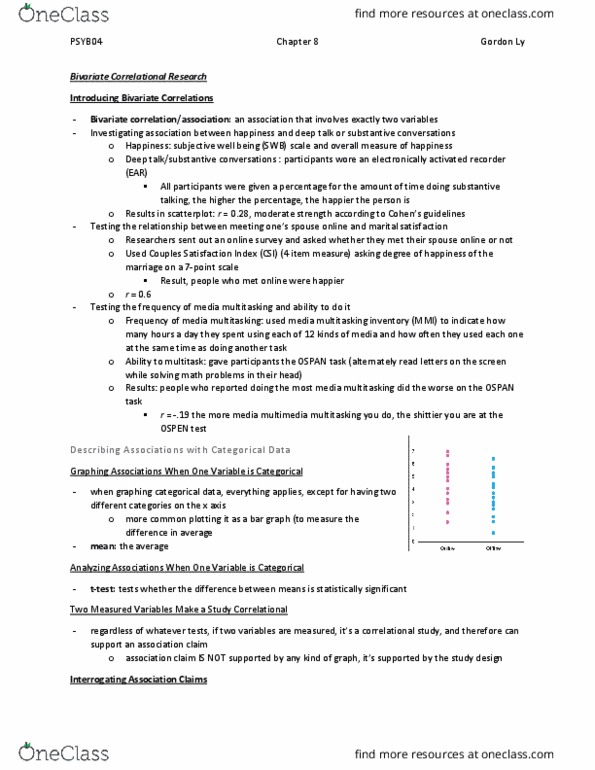
→ Describing Associations Using Scatterplots or the COrrelation Coefficient r
● Use scatterplots and r to desire association b/w two variables that measured in the same set of
cases
find more resources at oneclass.com
find more resources at oneclass.com
Document Summary
When researcher collects data from group of ppl it"s often a sample from a larger pop. Researchers don"t always study a sample from a larger pop. Variables what researchers measure or manipulate in a study. Take on different levels or values for diff members of a sample. After collecting data usually enter the data in a grid format (data matrix) using computer program. Each row represents a case (person, animal, state, price, etc) Techniques for organizing column of data in a data matrix. Frequency distribution table that gives a visual picture of the observation of a particular variable. Shows how many of the cases scores each possible value on the variable. Based on data from frequency distribution create a graph frequency histogram. Another option for organizing data visually is a graphical representation stemplot aka stem and leaf plot. Values of the left of the line = stems. First determine the units for the stems tens, hundreds, thousands.