PSYC14H3 Lecture Notes - Crouching Tiger, Hidden Dragon, Central Tendency, Frequency Distribution


Document Summary
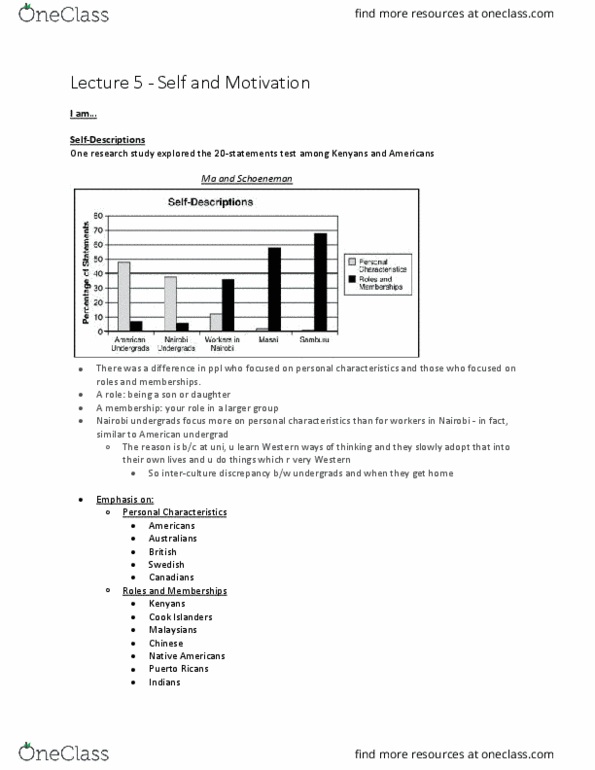
Frequency distribution: number of participants who receive each possible score (graph of frequency: histogram) Central tendency: mean (average score), median (score that divides group in half), mode (most frequent score) T test = difference between two groups / variability within two groups. We are more focused on our traits (rather than our roles) We are more likely to write positive traits than negative traits. One research study explored the 20 statements test among kenyans and americans (ma and schoeneman 1997) Workers in nairobi have about 10% personal characteristics and 35% roles and membership, masai and samburu have hardly any personal characteristics and about 60 to 70% roles and memberships (respectively) Nairobi undergrads are basically the reverse of workers in nairobi, having a larger amount of personal characteristics and few roles and memberships. The american undergrads are strikingly similar to nairobi undergrads.