STAB22H3 Lecture 7: Box Plot Diagrams, Density Curves, Normal Distribution, Mean, Standard Deviation, Z-Scores & Standardization

29 Jan 2019
School
Department
Course
Professor
STAB22H3 verified notes
7/18View all
Document Summary
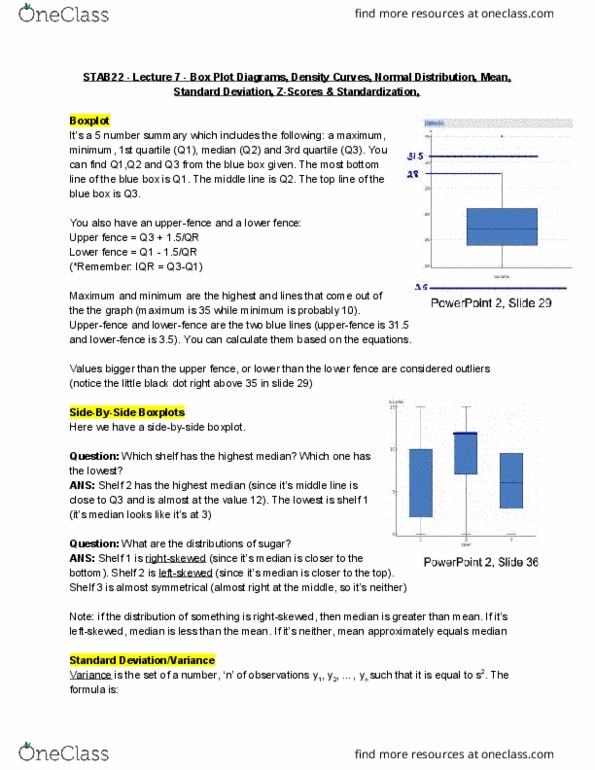
Stab22 - lecture 7 - box plot diagrams, density curves, normal distribution, mean, It"s a 5 number summary which includes the following: a maximum, minimum, 1st quartile (q1), median (q2) and 3rd quartile (q3). You can find q1,q2 and q3 from the blue box given. The most bottom line of the blue box is q1. The top line of the blue box is q3. You also have an upper-fence and a lower fence: Lower fence = q1 - 1. 5/qr (*remember: iqr = q3-q1) Maximum and minimum are the highest and lines that come out of the the graph (maximum is 35 while minimum is probably 10). Upper-fence and lower-fence are the two blue lines (upper-fence is 31. 5 and lower-fence is 3. 5). You can calculate them based on the equations. Values bigger than the upper fence, or lower than the lower fence are considered outliers (notice the little black dot right above 35 in slide 29)