STAB22H3 Lecture Notes - Lecture 5: Linear Regression, Scatter Plot, Dependent And Independent Variables


38
STAB22H3 Full Course Notes
Verified Note
38 documents
Document Summary
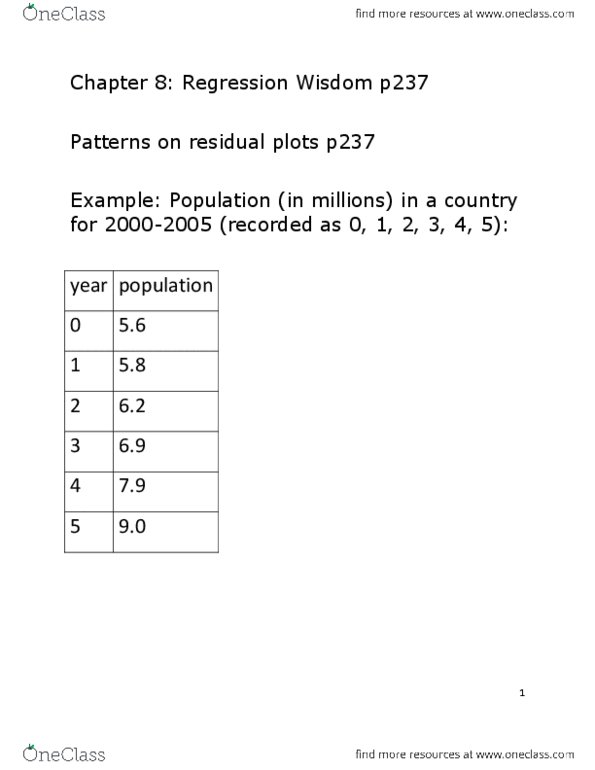
Example 1: population (in millions) in a country for 2000-2005 (recorded as 0, 1, 2, 3, 4, 5). The regression equation is: population = 5. 19 + 0. 686 year, and the coefficient of determination if r2 = 93. 5% Nonlinearity (a curve rather than a line) is more prominent. Sifting residuals for groups: no regression analysis is complete w/o a display of the residuals to check that the linear model is reasonable, residuals often reveal subtleties that were not clear from a plot of the original data. Sometimes they reveal violations of the regression conditions that require out attention. It is a good idea to look at both a histogram of the residuals and a scatterplot of the residuals versus the predicted values of the explanatory variable. Outliers: any point that stands away from the others can be called an outlier and deserves your special attention, outlying points can strongly influence a regression.