STAB22H3 Lecture 10: Correlation and Its Properties, Correlation & Causation, Linear Regression & Least Square Regression Lines, Coefficient of Determination, Residuals

6 Feb 2019
School
Department
Course
Professor
STAB22H3 verified notes
10/18View all
9
STAB22H3 Lecture 9: Normal Quantile Plots, 68-95-99.7 Rule, Scatterplots, Correlation and it's Properties
10
STAB22H3 Lecture 10: Correlation and Its Properties, Correlation & Causation, Linear Regression & Least Square Regression Lines, Coefficient of Determination, Residuals
11
STAB22H3 Lecture 11: Patterns in Residual Plots, Outliers, Leverage, & Influence
Document Summary
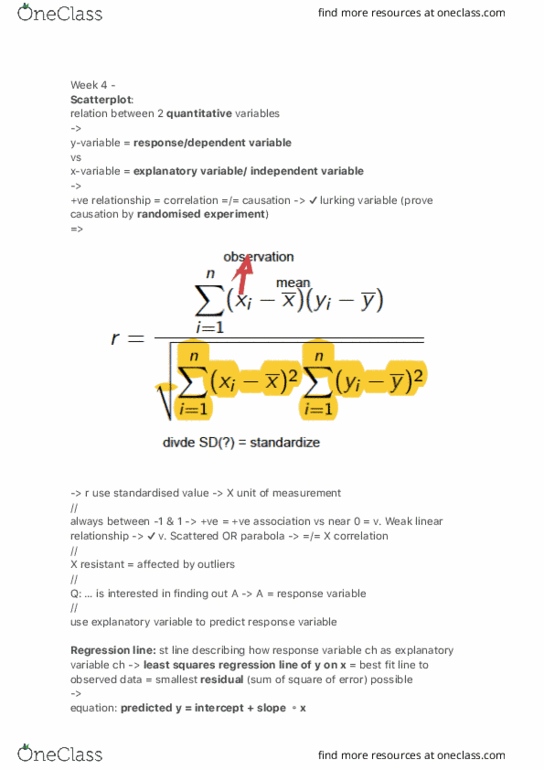
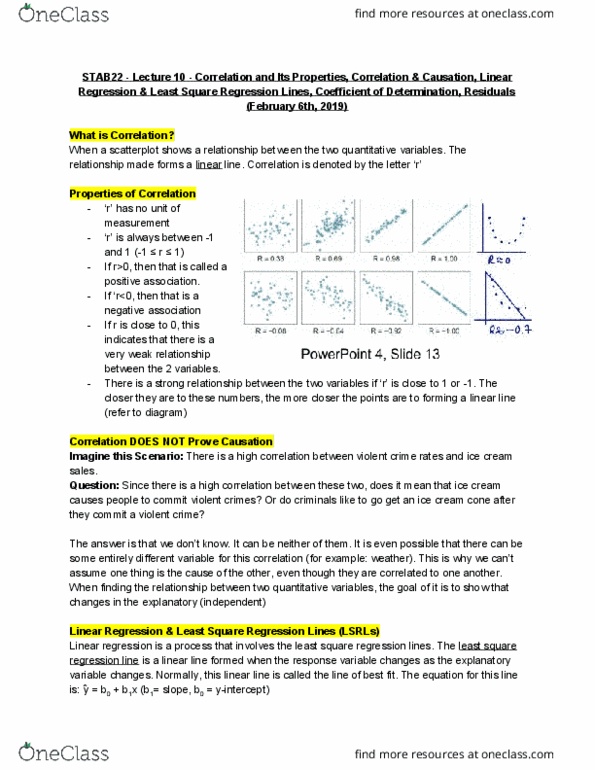
Stab22 - lecture 10 - correlation and its properties, correlation & causation, linear. Regression & least square regression lines, coefficient of determination, residuals (february 6th, 2019) When a scatterplot shows a relationship between the two quantitative variables. R" is always between -1 and 1 (-1 r 1) If r>0, then that is called a positive association. If r<0, then that is a negative association. If r is close to 0, this indicates that there is a very weak relationship between the 2 variables. There is a strong relationship between the two variables if r" is close to 1 or -1. The closer they are to these numbers, the more closer the points are to forming a linear line (refer to diagram) Imagine this scenario: there is a high correlation between violent crime rates and ice cream sales. It is even possible that there can be some entirely different variable for this correlation (for example: weather).