STAB22H3 Lecture Notes - Lecture 4: Cardiovascular Disease, Linear Regression, Simple Linear Regression


38
STAB22H3 Full Course Notes
Verified Note
38 documents
Document Summary
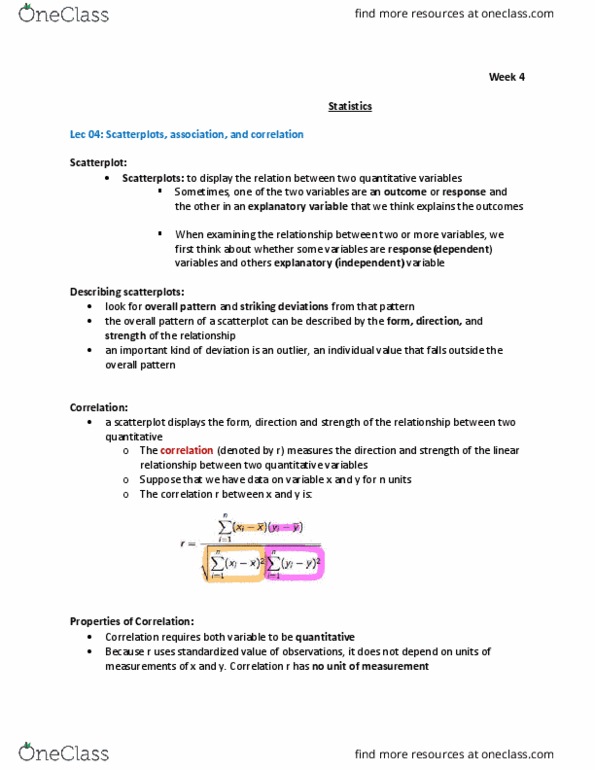
Chapter 7 : scatterplots, association and correlation p168. Plot values of two quantitative variables against each other (scatterplot). Outcome or response, and the other explains the outcome, an explanatory variable. Look for overall pattern and striking deviations from that pattern. The overall pattern of a scatterplot can be described by the form, direction and strength of the relationship. An important kind of deviation is an outlier, an individual value that falls outside the overall pattern. Pattern is fairly linear with a negative slope. This means that higher levels of wine consumption are associated with lower death rates. This does not mean there is a causal effect. Higher wine consumption could be linked to higher income, which would allow better medical care. Statcrunch commands: graph > scatter plotex 16,(a), (b), p192. The correlation r between x and y is r x x y y x x.