EEB225H1 Lecture Notes - Lecture 12: Total Variation

14 Mar 2017
School
Department
Course
Professor
Document Summary
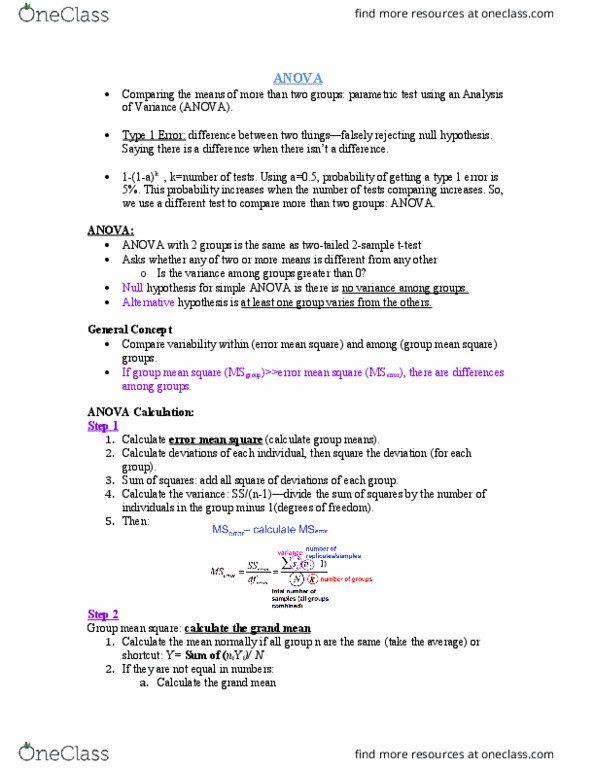
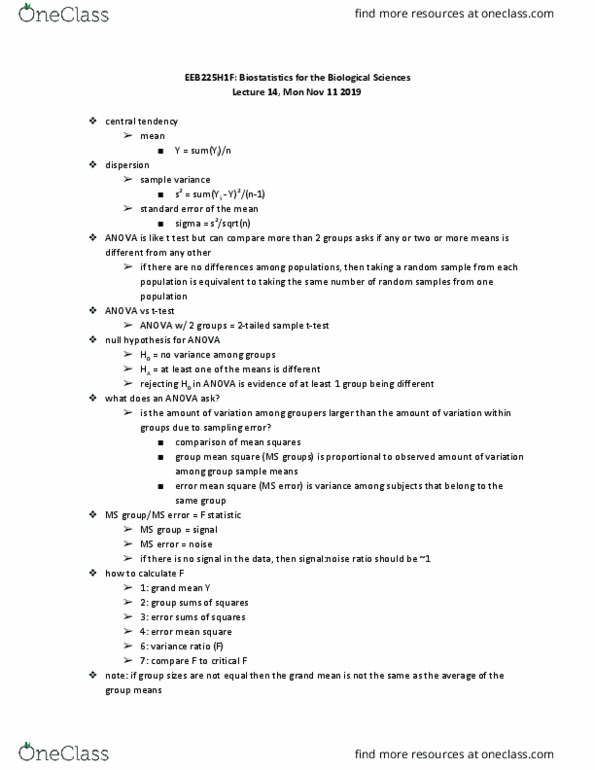
Like a t-test, but can compare the means of two or more groups simultaneously. Asks whether any of two or more means is different from any other. H0 = all populations have equal means. Ha = at least one population mean is different. Sum of squares : can distribute the same variation (ss) over more than one mean (ha, i. e. , chop up the sums of squares in 3 different ways. Total: the sum of all deviations of all observations from the grand mean. Group: the sum of deviations of each mean from the grand mean. Error: the sum of deviations of each observation from its group mean. Total ss = error ss + group ss. Total variation in the data under the null model error in h0. Variance explained by the groups (mismatch between grand means and group means) Variance not explained by the ha (error in ha)