EEB225H1 Lecture Notes - Lecture 14: Scatter Plot, Survival Analysis, Dependent And Independent Variables

21 Mar 2017
School
Department
Course
Professor
Document Summary
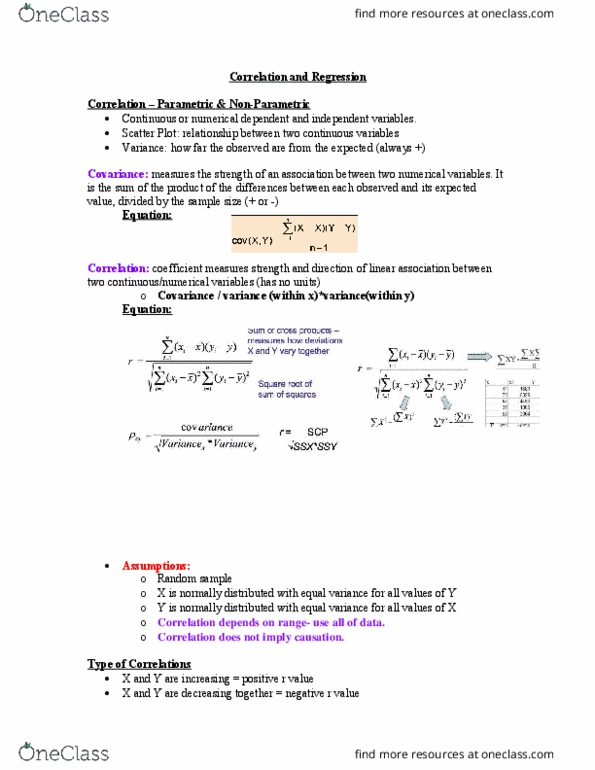
Describes the relationship between two numerical variables: strength and direction. Estimate: r reflects the scatter in a scatter plot correlation coefficients facts the number (-1 to 1) measures strength of the relationship: 1 of -1 is the strongest, 0 is the weakest. Positive or negative values of r indicates direction of relationship: negative: one variable increases while the other decreases, positive: both change is in the same direction (both variables increase or decrease) 0. 9 1. 0 (-0. 9 -1. 0): very high positive (negative) correlation. 0. 7 0. 9 (-0. 7 -0. 9): high positive (negative) correlation. 0. 5 0. 7 (-0. 5 -0. 7): moderate positive (negative) correlation. 0. 3 0. 5 (-0. 3 -0. 5): low positive (negative) correlation. Sum of cross products divided by square root of sum of squares . H0 = variable 1 and variable 2 are not related: = 0. Ha = variable 1 and variable 2 are correlated: 0 t statistic t = r / ser. With df = n-2 standard error of r.