EEB225H1 Lecture Notes - Lecture 5: Multivariate Normal Distribution, Pearson Product-Moment Correlation Coefficient, Scatter Plot

28 Apr 2016
School
Department
Course
Professor
Document Summary
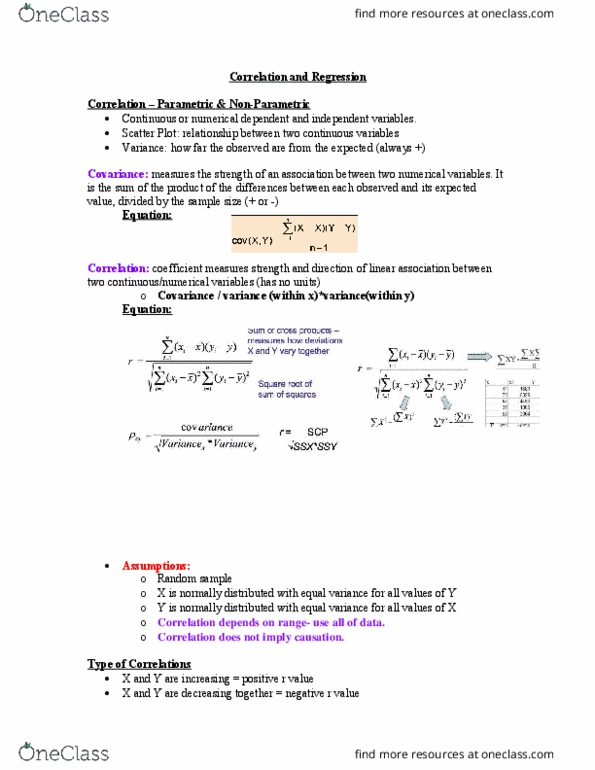
Correlation coefficient: (aka pearson correlation coefficient , pearson product moment correlation coefficient: measures tendency of two numerical variables to co-vary (to change together). Numerator= sum of products; measures how deviations in x and y vary together. Deviation is the difference between an observation and its mean. Denominator: square root of sum of squares. Assumptions: random sample, bivariate normal distribution in the population (bell shaped probability distributed in three dimensions rather than two. Frequency distribution for x and y are separately linear. X normally distributed with equal variance for all values of y. Y is normally distributed with equal variance for all values of c. Relationship between x and y is linear. Cloud of point in scatter plot of c and y has a circular or elliptical shape. Departures from bivariate normality in a scatter plot: Cloud of points that is funnel shaped (wider at one end than the other. Relationship between x and y that is not linear.