EEB225H1 Lecture Notes - Lecture 6: Squared Deviations From The Mean, Dependent And Independent Variables, Sampling Error

28 Apr 2016
School
Department
Course
Professor
Document Summary
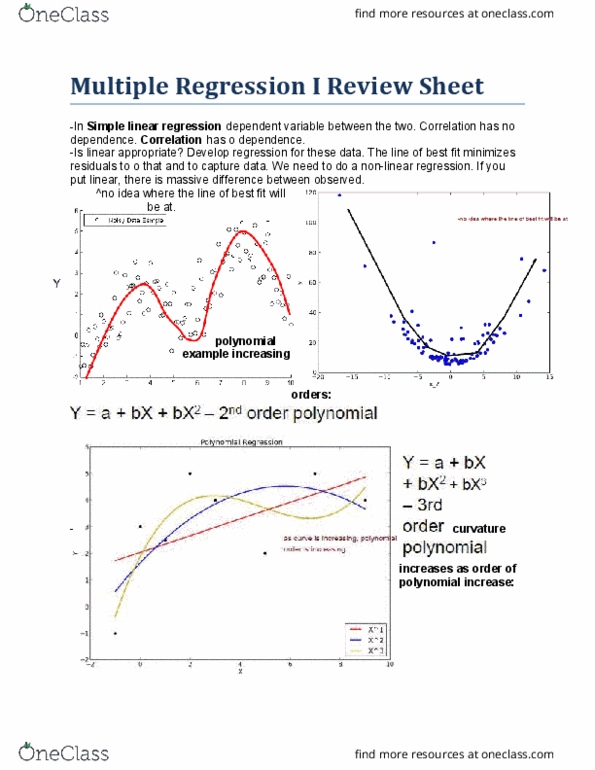
Draws straight line through a scatter plot to predict the response variable (y) and explanatory variable (x). The main purposes of the linear regression is to describe relationship between x and y and to predict y from x. Line that leads to the smallest possible deviations in. Y between the data points and the regression line; Assume random sample of (x,y) pairs of measurements from a population. Relationship between two variables (x and y) is linear; i. e can be described by a line. One variable is the dependent numerical variable (response) and one is independent (predictor). There is a population of possible y-values for every value if x; the mean y for every value of. Calculated to use it to estimate the true regression of y on x in the population from which the data are a sample. Y= response variable, x=explanatory variable, =y-intercept (y when x=) and b=slope of the regression line (how much y changes in x).