GGR270H1 Lecture Notes - Social Statistics, Descriptive Statistics, Central Tendency

Document Summary
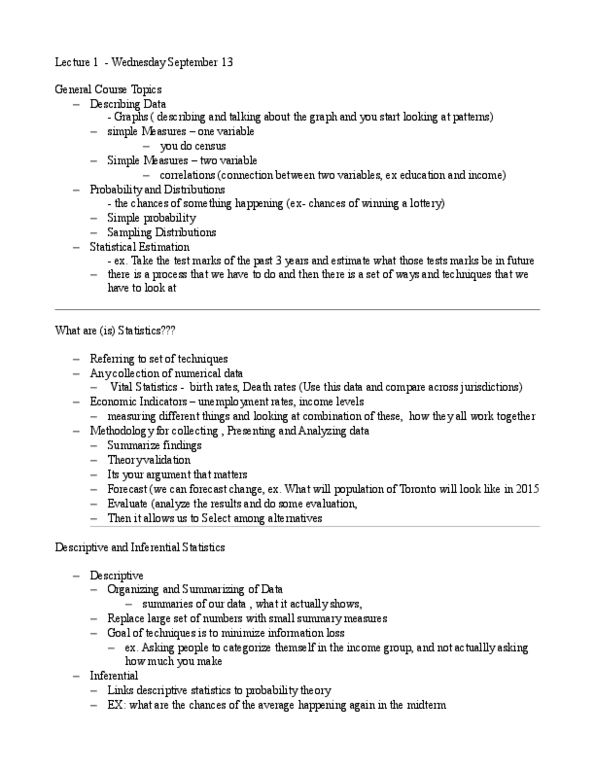
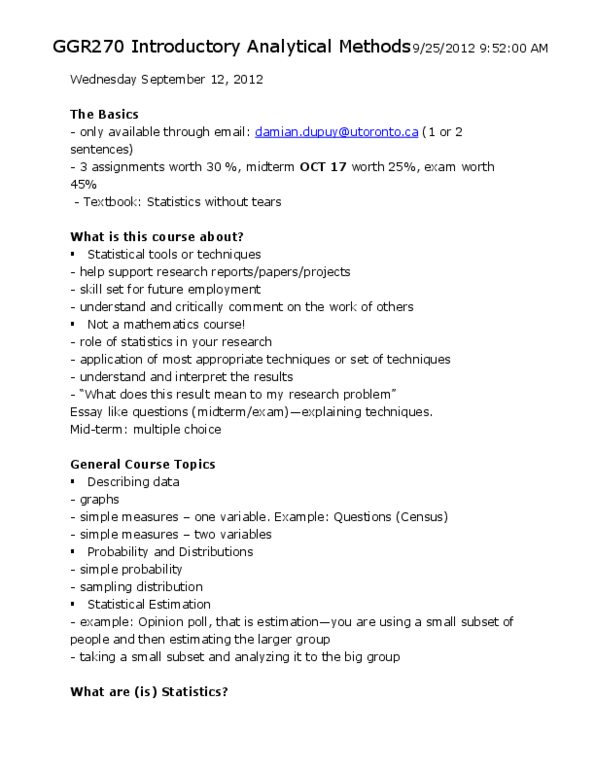
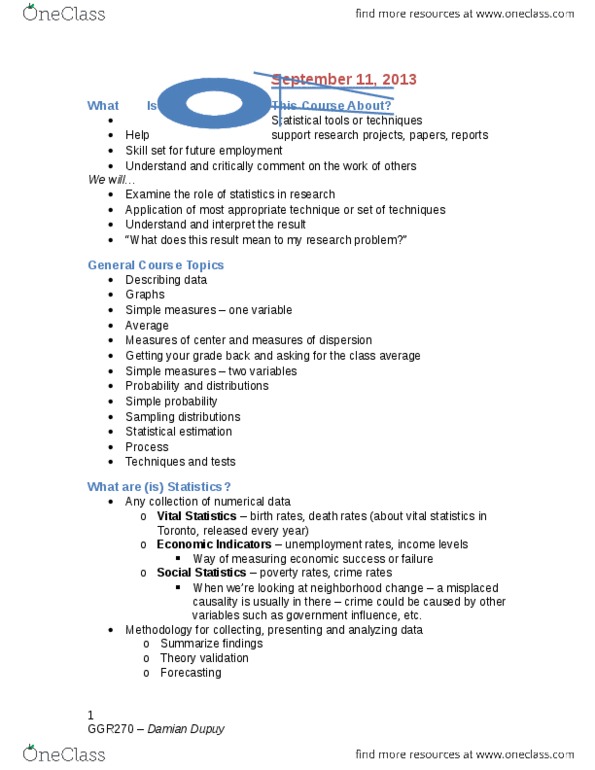
Describing data: for describing data you use graphs and simple measures (1 or 2 variables) ex. High levels of income cause high levels of education: correlation. Understand and critically comment or work of others. Understand and critically comment on work of others. Application of most appropriate technique or set of techniques. What does this research mean to my research problem . Probability: chances of something happening or not (ex. What are the chances of winning the lottery?) Statistics are basically referring to a set of techniques. Any collection of numerical data: vital statistics: ex. birth rates, death rates (is there more birth rates than death rates) Economic indicators: ex. unemployment rates, rates of job creation, series of economic rates. Social statistics: ex. poverty rates, crime rates. We can use these statistics and relate to each other to see how they work together (ex. Statistics can be also referred to as a methodology for collecting, elaborating or presenting, and analyzing data.