PSY201H1 Lecture Notes - Lecture 3: Square Root, Level Of Measurement, Squared Deviations From The Mean

Document Summary
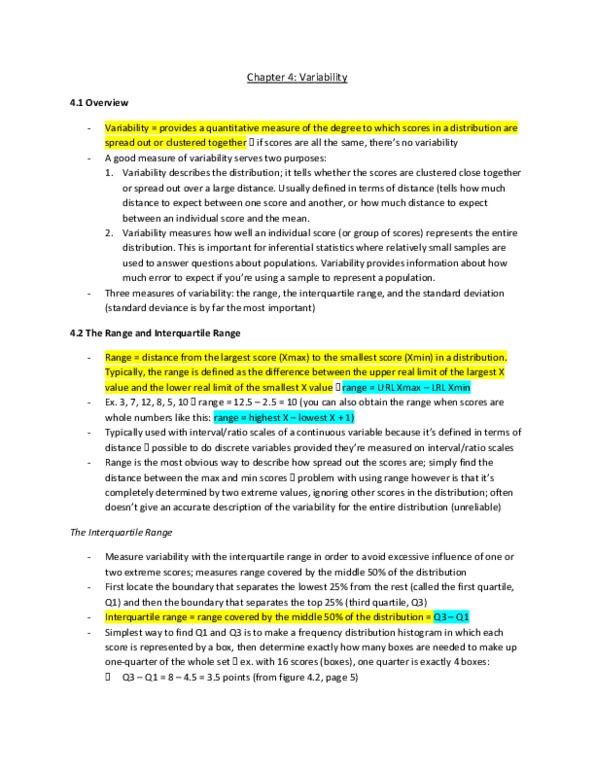
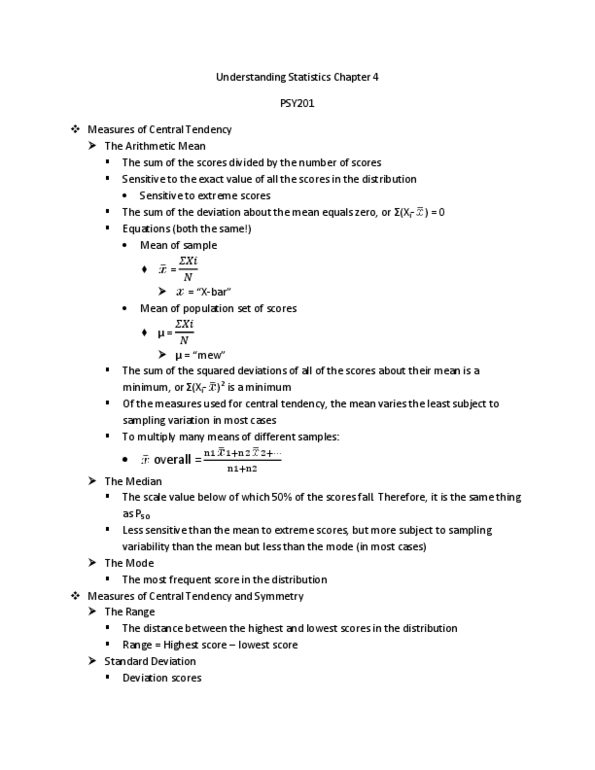
Variability allows us to quantify how much do scores in a distribution differ vs clump together. Allows to describe and picture a distribution. Indicates the distance between the highest value on variable and the lowest values on that variable. E. g. the heights in a classroom ranges from 75 to (cid:1009)(cid:1007) (cid:894)(cid:272)o(cid:374)ti(cid:374)uous (cid:448)a(cid:396)ia(cid:271)le(cid:895) Could be considered range between the upper real limit (url) of xmax and the lower real limit (lrl) of xmin. Range= url for xmax-lrl for xmin= 75. 5-52. 5=23. Range is a function of only the two most extreme scores. A group of data/people is a population if it represents the entirety of the people you want to draw conclusions about. A group of data/people is a sample if it represents a selection from the group you want to know about. Deviation of a score refers to that scores distance from the mean.