PSY201H1 Lecture Notes - Lecture 2: Frequency Distribution, Level Of Measurement, Percentile Rank

Document Summary
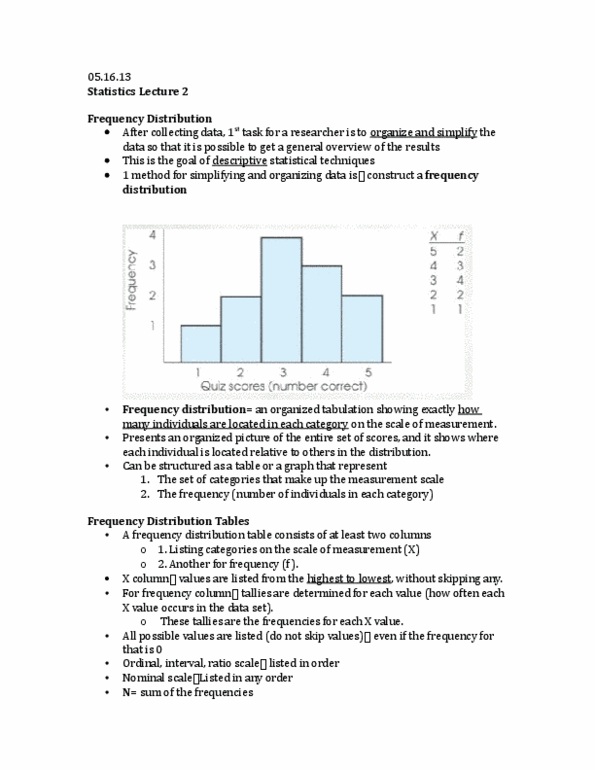
Graphs: frequency distribution: organized tabulation of entire set of scores allowing to see big picture in data at a glance. Shows where each indiv is located relative. For nominal, any order get sense of patterns elements: Record of the frequency (# of indiv in each measurement scale cat) Freq distr tables: consist of at least 2 columns: If you are asked for x, do not add up the values in the x column so don"t use the freq dirt table. Add up all of the raw scores for x instead. Use the same method to calculate x2: calculate proportions&percentages to describe distr. Proportion (aka relative freq) measures fraction of total grp associated w each score. Percentage = p(100) = f/n x (100) List of x values is way too long for simple. Use a grouped freq distr table presentation of data. X column lists class intervals: grps of scores.