PSY202H1 Lecture Notes - Lecture 6: Statistical Hypothesis Testing, Venn Diagram, Convergent Validity


Document Summary
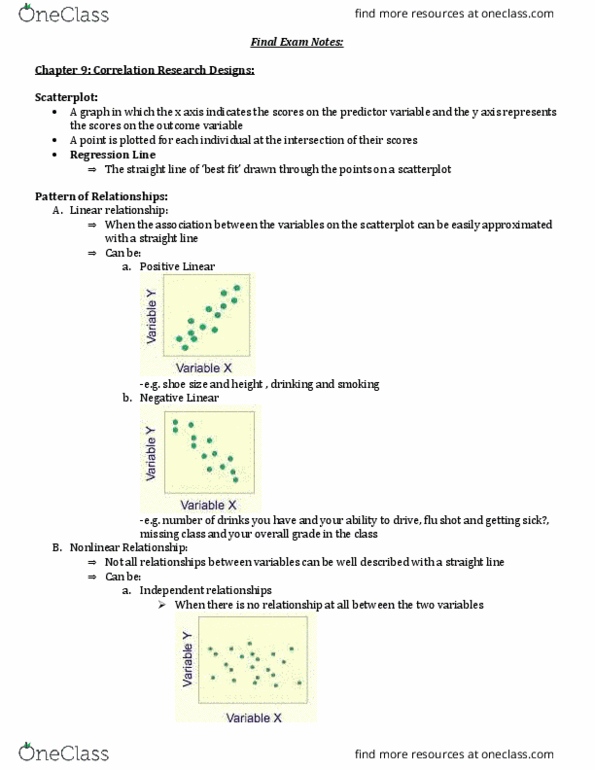
Everything we talked about so far were categorical predictors: iq score, self esteem, test score, hours of sleep etc. Now we introduce analyses where both variables of interest are continuous, we"re interested in a relationship/association instead of comparison. When both variables of interest are continuous, we use pearson correlation or linear regression. Chi square analysis (we talk about this later) is when 2 variables of interest are categorical. Correlation is direction and strength of an association b/w two variables. Typically used in non experimental research bc when we manipulate something experimentally it"s in categories, which would be ordinal. Tools for correlation are: the scatterplot: it"s a figure. It shows association b/w two variables: the pearson correlation coefficient: it"s a statistic that describes the direction and strength of a linear association b/w two continuous variables. In correlation, n is the number of pairs of scores. Linear relationship of interest: describes variables that can be well represented by a straight line.