SOC100H1 Lecture Notes - Lecture 8: Gross Domestic Product, International Inequality, Gini Coefficient


Lecture 8: Global Inequality
● Defining ‘global inequality’
○ Global inequality: the widely different opportunities people in different
societies have for securing a goodie, healthy, prosperous) life
■ The global north: countries in the northern, higher-income countries
like the U.S., Canada, and Western Europe
■ The global south: countries in the southern hemisphere which
generally have lower incomes
● Measuring income and wealth inequality
○ The Gini Index: based on the difference between the Lorenz curve and
line of perfect equality
○ Many low-income countries are more unequal than higher-income ones
○ Scandinavia, Canada, Australia, and western Europe are fairly equal
○ The wealthiest people in the world control most of the world’s wealth
○ The top 20% of the world’s population control over 80% of the world’s
wealth
○ The world's wealthiest .001% control 30% of the world’s wealth
○ This reflects huge differences in per capita wealth around the world
○ Over time, world income inequality is declining, though still high
■ This is due to the gradual movement of wealth to the global south
● Measures of global wellbeing
○ 1. Gross Domestic Product (GDP) Per capita
find more resources at oneclass.com
find more resources at oneclass.com

■ We can gauge a country’s well-being from the total income of all
residents of a country, divided by its population GDP per capita
● U.S.---$55,836
● Canada---$43,249
● World---$10,004
● Mexico ---$9,009
● Nigeria---$2640
■ Note large national differences even if we consider “purchasing
power parity” (which measures the local cost of living)
■ Social inequalities influences how wellbeing is distributed in a
country
● Most of the world’s millionaires live in a few countries (mainly
in the global north)
○ Most poor people live in global south countries
● But even in high income northern countries, many are poor
○ And in low income southern countries, some are rich
○ 2. Human Development Index (HDI)
■ HDI: tool developed by the UN to measure countries’ levels of
human development
● The HDI combines 3 measures of wellbeing:
○ Standard of living: measured by the GDP per capita
○ Life expectancy: average longevity and health,
measured by life expectancy at birth
find more resources at oneclass.com
find more resources at oneclass.com

○ Human capital: average formal education and
knowledge, measured by adults and youth literacy
measures
○ Comparing the two measures
■ The GDP ignores inequality, so it can be misleading
● In a highly unequal country, a few people may monopolize
the society’s wealth while most people are poor
○ The HDI is far more likely to capture the experience of
the average people
● Some countries rank far higher on the HDI than on the GDP
per capita measure, and vice versa
○ Canada has a high HDI score but not the highest
GDP per capita
○ Kuwait and the United Arab Emirates have high GDP
per capita scores but not high HDI scores
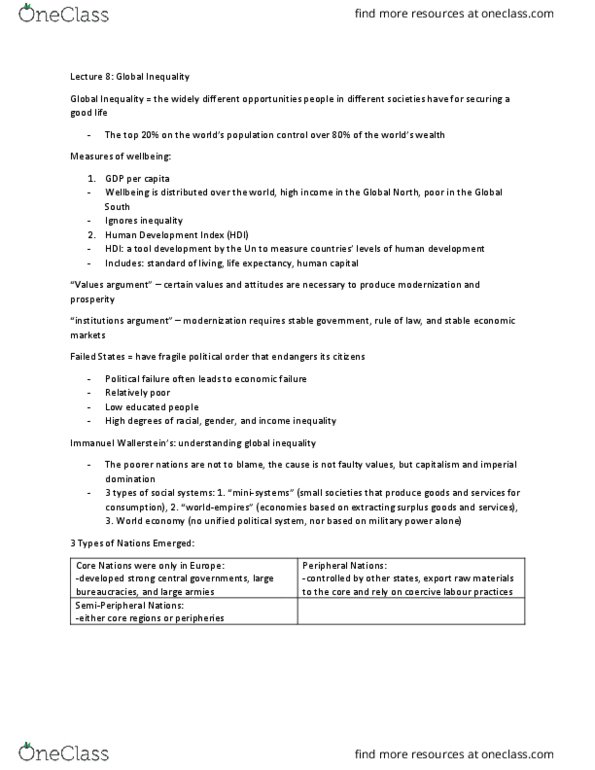
● Explaining global inequality: The Wealth of Nations (1776)
○ The systematic study of global inequality began about 250 years ago, with
Adam Smith’s The Wealth of Nations
■ Why are some nations wealth and powerful?
● Because of trade
● Trade allows individuals to maximize their well-being through
specialization
○ I.e., nations benefit from specialization and trade
find more resources at oneclass.com
find more resources at oneclass.com


26
SOC100H1 Full Course Notes
Verified Note
26 documents
Document Summary
Global inequality: the widely different opportunities people in different societies have for securing a goodie, healthy, prosperous) life. The global north: countries in the northern, higher-income countries like the u. s. , canada, and western europe. The global south: countries in the southern hemisphere which generally have lower incomes. The gini index: based on the difference between the lorenz curve and line of perfect equality. Many low-income countries are more unequal than higher-income ones. Scandinavia, canada, australia, and western europe are fairly equal. The wealthiest people in the world control most of the world"s wealth. The top 20% of the world"s population control over 80% of the world"s wealth. The world"s wealthiest . 001% control 30% of the world"s wealth. This reflects huge differences in per capita wealth around the world. Over time, world income inequality is declining, though still high. This is due to the gradual movement of wealth to the global south.