SOC202H1 Lecture Notes - Lecture 2: Intel 8089, Standard Deviation, Interquartile Range

Document Summary
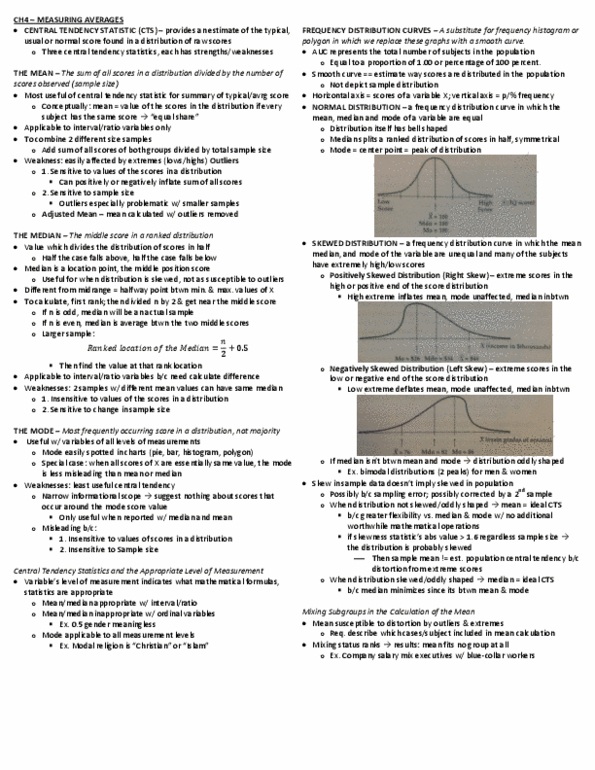
Finishing up frequency distributions and graphical tools interval-ratio variables. When we have interval-ratio variables, we commonly collapse a range of scores into a manageable number of categories (aka intervals). We have a sample of 40 adults and we wish to present a frequency distribution of the variable age. Cumulative frequency and cumulative percentages tell us how many cases fall at or below a specific score of interval of scores in a distribution. Histograms are used to visually portray interval-ratio distributions and use class intervals, just like the prior frequency distribution examples. Distribution of hours students report studying for into to sociology exam. Like bar graphs, histograms place the frequencies on the vertical (y axis). The height of each bar represents the frequency of an interval of data (as represented on x axis). Unlike bar graphs, histograms have no spaces between bars. Like all visual displays, histograms require a title.