SOC202H1 Lecture Notes - Lecture 9: Null Hypothesis, Marginal Distribution, Test Statistic

Document Summary
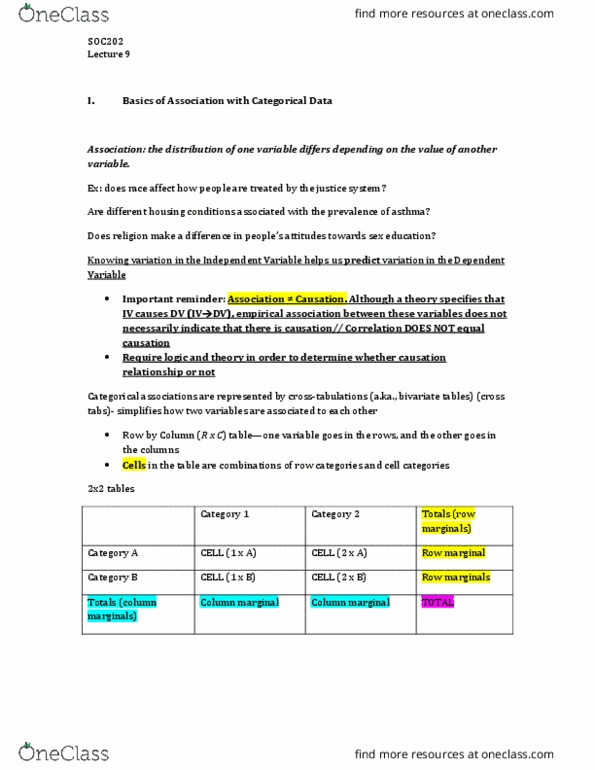
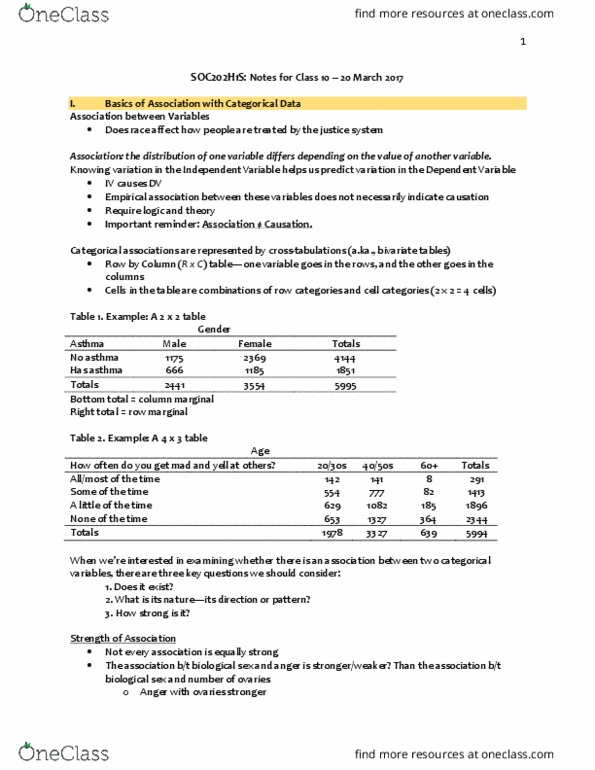
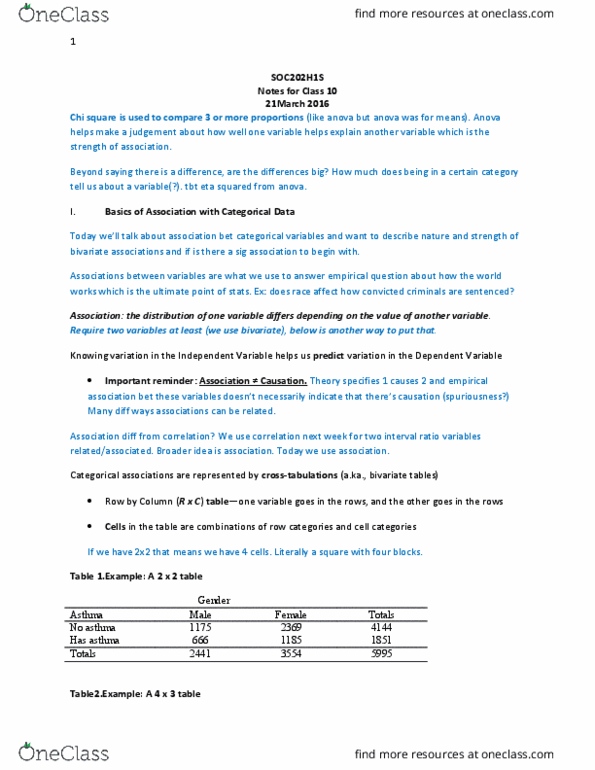
Association: the distribution of one variable differs depending on the value of another variable. Knowing variation in the independent variable helps us predict variation in the dependent variable. Are we talking about two variables that are ordinal or nominal. When variables are ordinal, then we can determine whether the association is positive or negative. Negative = high values of one variable tend to correspond with low values on another variable. Strength of association not every association between variables is strong, some can be weak. Biological sex associated with number of ovaries determinative association, x and y chromosomes. When at least one variable is nominal, we can still talk about variables being asso(cid:272)iated, (cid:271)ut (cid:862)di(cid:396)e(cid:272)tio(cid:374)(cid:863) is(cid:374)(cid:859)t a(cid:374) applicable descriptor. Example: a negative association with a reduced sample size (frequency = 50 for each age group) *note: high (cid:448)alues of the depe(cid:374)de(cid:374)t (cid:448)aria(cid:271)le (cid:894)(cid:455)ell (cid:862)all(cid:863) or (cid:862)(cid:373)ost(cid:863) of the ti(cid:373)e(cid:895) highest a(cid:373)o(cid:374)g the (cid:455)ou(cid:374)g adults (the lowest value for the independent variable).