STA220H1 Lecture Notes - Lecture 1: Standard Deviation, Interquartile Range, Frequency Distribution


STA220H1 verified notes
1/12View all
1
STA220H1 Lecture Notes - Lecture 1: Standard Deviation, Interquartile Range, Frequency Distribution
2
STA220H1 Lecture Notes - Lecture 2: Categorical Variable, Dependent And Independent Variables, Scatter Plot
3
STA220H1 Lecture Notes - Lecture 3: Mutual Exclusivity, Collectively Exhaustive Events, Sample Space
Document Summary
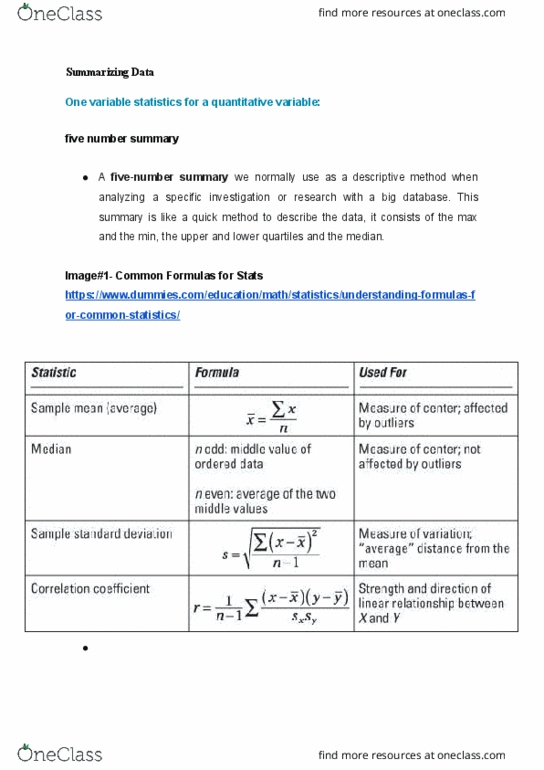
One variable statistics for a quantitative variable: five number summary. A five - number summary we normally use as a descriptive method when analyzing a specific investigation or research with a big database. This summary is like a quick method to describe the data, it consists of the max and the min, the upper and lower quartiles and the median. A trimmed mean is basically the mean but with the exclusion of outliers points, meaning the points that are either too small or too big when looking at the mean. It is a way to eliminate human errors interquartile range (iqr) Meaning we get the 75th percentile of our data range, and the 25th percentile, and then subtract it . How far a measure deviates from the mean in terms of deviationspattern. When the z score is positive this indicates that the data is above the. Mean and when it is negative means that the data is below the mean.