STA221H1 Lecture Notes - Lecture 16: Quantile, Pectin, Box Plot

25 Feb 2018
School
Department
Course
Professor
Document Summary
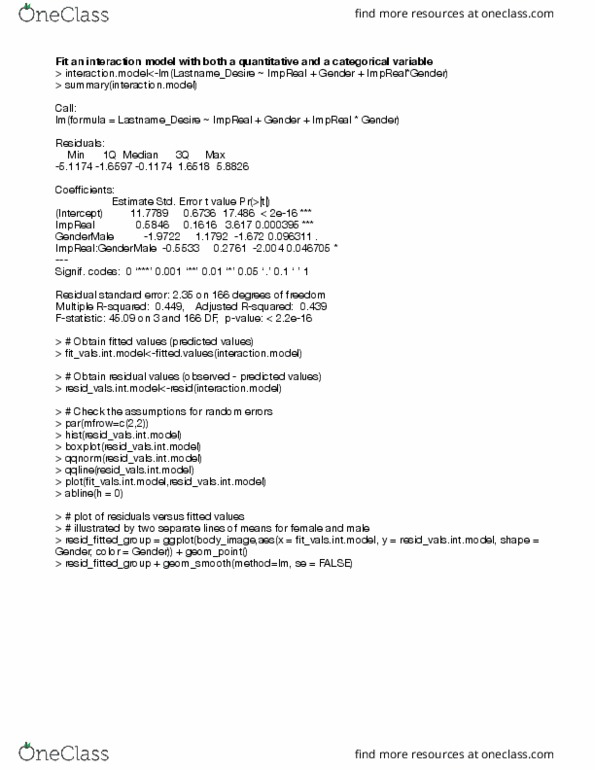
> # format the value of sum of resids. > # obtain summary statistics for residual values. > # plot the scatterplot of sweet_aslemand and pectin. > # show the tted line on the plot. > # use plot of residuals verses their tted values to: > # use plot of residuals verses their x-values to: > # check the assumption: random errors have mean zero. > # check the assumption: random errors have a constant variance. > # add the horizontal line to the plot (to show mean zero) > # note this plot is the same as plot of resids vs tted values. > # because there is only one predictor variable in the model. > # use normal q-q plot (quantile by quantile plot) of residuals to (another way): > # check the assumption: random errors are normally distributed.