STA221H1 Lecture Notes - Lecture 29: Botulism, Summary Statistics, Dependent And Independent Variables

19 Mar 2018
School
Department
Course
Professor
Document Summary
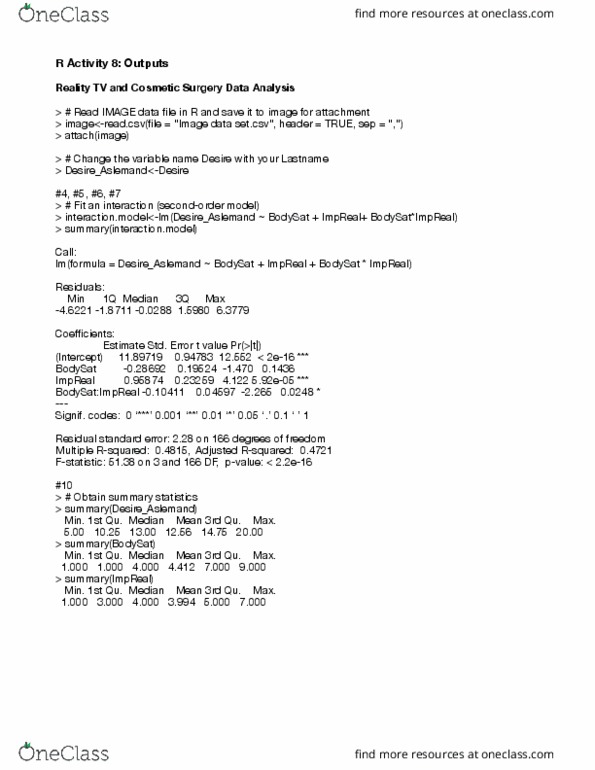
> # obtain information regarding the unusual observation. > # create a subset data with high estimated rates of greater than 30000. > # create another subset data with n = 23 observation. > # != means "is not equal to" > # rename the variable names in the new data set with n = 23 observations. > # change the response variable with your lastname. > # note: we will use the $ sign to extract variables from a di erent data set. > # scatterplot of incidence vs. estimate (for n = 23, new data set) > # fit a second-order model with a curvature term to: > # the new data set with n = 23 observation. > curve. model. 23obs|t|) (intercept) 7. 350e+02 6. 959e+02 1. 056 0. 303 estimate -8. 095e-02 3. 167e-01 -0. 256 0. 801 estimate. square 1. 505e-04 8. 683e-06 17. 336 1. 62e-13 ***