STA221H1 Lecture Notes - Lecture 71: Analysis Of Variance, Box Plot, Factorial Experiment

29 Apr 2018
School
Department
Course
Professor

Textbook Exercises Set 53
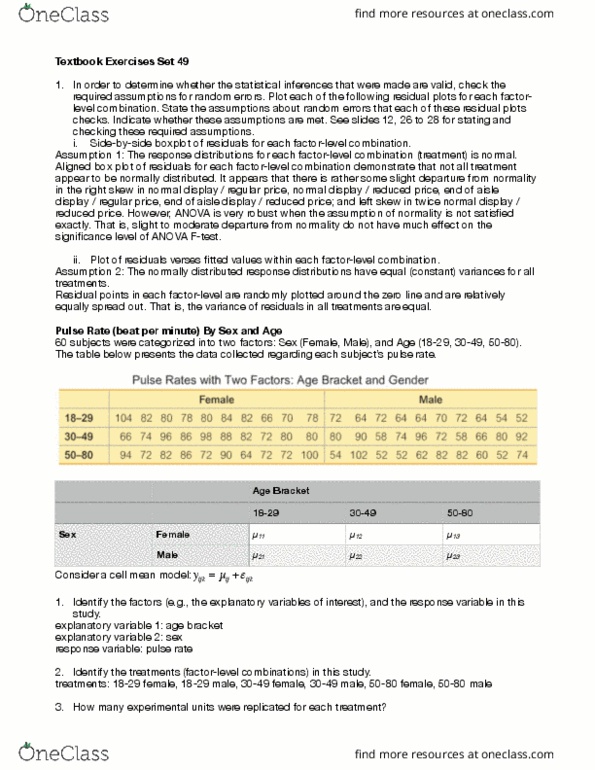
1. Obtain the estimated marginal means for the levels of age factor. Construct the main effect plot of
age. What do you observe?"
Main effect of age bracket is likely to be present. That is, averaging over sex, mean pulse rate for
30-49 appears to be the greatest. 50-80 is intermediate, with a slightly higher mean pulse rate than
18-29. "
2. Fit a complete factorial design model: #in R. Obtain the ANOVA table for pulse rate
using the aov function. Suppose the researchers aimed to investigate the interaction effect, and
the main effects. For each factor effect:"
i. State the null and the alternative hypotheses using µ symbols."
ii. State the value of the test-statistic and its p-value."
iii. Make a decision regarding whether to reject or fail to reject Ho."
iv. In plain, non-statistical language, state your conclusion. "
1. Interaction Effect: Does the effect of sex on average pulse rate depend on age? Same
question rephrased: Does the mean difference in pulse rate between males and females
depend on age? Same question rephrased: Does the mean difference in pulse rate between
males and females differ among different age groups?"
i. # "
ii. F = 0.939, p = 0.397290"
iii. cannot reject H0"
iv. We have no evidence that the effect of sex on average pulse rate depends on age. That is, we
have no evidence that the mean difference in pulse rate between females and males differ
among different age brackets. "
2. Main Effect of Sex: Averaging over age level, does sex of the subject have an effect on their
average pulse rate? Same question: Averaging over age level, is there a difference in mean
pulse rate between males and females?"
i. # "
ii. F = 13.591, p = 0.000528"
iii. reject H0"
iv. We can conclude that, averaging over age level, mean pulse rate differs among females and
males. "
3. Main Effect of Age: Averaging over sex level, does age of the subject have an effect on their
average pulse rate? Same question: Averaging over sex level, is there a difference in mean
pulse rate among different age group?"
i. # "
ii. F = 1.816, p = 0.172531"
iii. cannot reject H0"
iv. We have no evidence that, averaging over sex level, mean pulse rate differs among different
age groups."
3. In order to determine whether the statistical inferences that were made are valid, check the
required assumptions for random errors. Plot each of the following residual plots for each factor-
yijk =µij +
ε
ijk
H0:µ11 −µ21 =µ12 −µ22 =µ13 −µ23
Ha: at least two of the treatment means differ
H0:µ11 +µ12 +µ13
( )
3
=µ21 +µ22 +µ23
( )
3
Ha: the two treatment means differ
H0:µ11 +µ21
( )
2
=µ12 +µ22
( )
2
=µ13 +µ23
( )
2
Ha: at least two of the treatment means differ
find more resources at oneclass.com
find more resources at oneclass.com
Document Summary
Textbook exercises set 53: obtain the estimated marginal means for the levels of age factor. Main e ect of age bracket is likely to be present. That is, averaging over sex, mean pulse rate for. 50-80 is intermediate, with a slightly higher mean pulse rate than. 18-29: fit a complete factorial design model: # yijk. = ij ijk in r. obtain the anova table for pulse rate using the aov function. Suppose the researchers aimed to investigate the interaction e ect, and the main e ects. For each factor e ect: state the null and the alternative hypotheses using symbols, state the value of the test-statistic and its p-value, make a decision regarding whether to reject or fail to reject ho. iv. : at least two of the treatment means differ: f = 0. 939, p = 0. 397290, cannot reject h0, we have no evidence that the e ect of sex on average pulse rate depends on age.