1) All else being equal, the more important an item is in buyers' budgets, the more elastic is the demand for the good. (TRUE/FALSE)
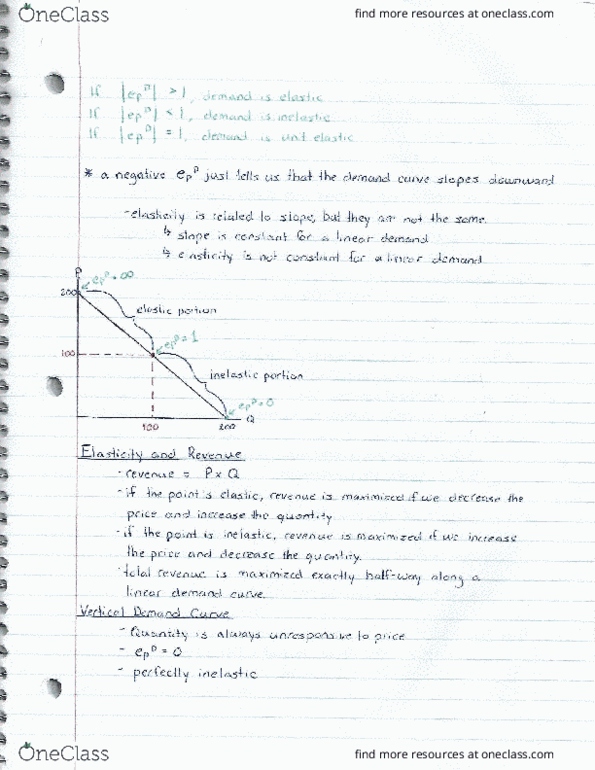
2) If the demand curve for a good is a steep, straight line, then the demand for the good is inelastic at every point along that demand curve. (TRUE/FALSE)
3)If the demand for illegal drugs is inelastic, then government efforts to reduce the supply of illegal drugs are likely to cause an increase in total expenditure on them. (TRUE/FALSE)
4) If the demand for mass transit in a city is inelastic, then raising fares will increase mass transit revenue. (TRUE/FALSE)
5)The cross-price elasticity of demand between Levi's blue jeans and Wrangler's blue jeans is most likely positive (TRUE/FALSE)
6) Perfectly inelastic demand occurs when the demand curve is horizontal. (TRUE/FALSE)
7) Among the reasons that farmers' incomes are unstable is _____
A) The supply curve for food can shift dramatically rightward or leftward from year to year.
B) The demand for food is elastic
C) The income elasticity for food is very high
D) All of these
E) None of these
8) If the (absolute value of) the price elasticity of demand for a good is greater than one, then demand for the good is _____
A) Elastic
B) Inelastic
C) Inferior
D) Normal
E) Paranormal
9) As we move leftward along a straight-line demand curve, the (absolute value of the) price elasticity of demand ____
A) Grows smaller
B) Remains constant at zero
C) Remains constant at a value of one
D) Remains constant and equal to the (absolute value of the) slope of the demand curve
E) Grows larger
10) If a good is normal, we know that______
A) income elasticity is positive
B) The good's price elasticity of demand is positive
C) Demand for the good is elastic
D) Demand for the good is inelastic
E) Income elasticity is negative
11) When the price of a good rise by 10%, and nothing else changes, the quantity of the good demanded falls by 5%. The price elasticity of demand for this good is_____
A) -0.5%
B) -5%
C) -5.0%
D) -2.0%
E) 2.0%
12) If the price elasticity of demand for a good is negative, we know that the good _____.
A) Obey's the law of demand
B) Is normal
C) Is inferior
D) Violates the law of demand
E) is inelastically demanded
13) Which of the following would you expect to have the greatest (in absolute value) price elasticity of demand?
A) Clothing
B) Pants
C) Blue jeans
D) Levi's Blue jeans
E) All of these answers would have approximately the same price elasticity of demand.
14) The price elasticity of demand for a good is -2.0 When the price of this good rises, what occurs?
A) Quantity demanded will rise as well
B) The income of those who buy the goodwill increase
C) Total expenditure on this goodwill fall.
D) All of these
E) All of these answers would have approximately the same price elasticity of demand.