PSYC 3130 Lecture Notes - Lecture 3: Statistical Parameter, Statistical Hypothesis Testing, Venn Diagram

13 Apr 2016
School
Department
Course
Professor
Document Summary
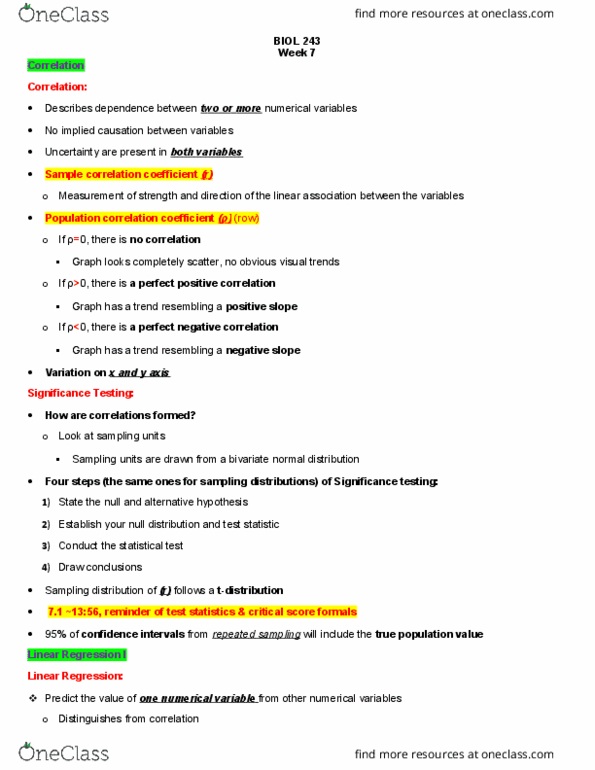
The relationship between two variables is the correlation coefficient. Regression is taking the correlation and using it to predict. Both variables have to be normally distributed. Observations within any one variable are independent of each other. The relation between the variables is linear. Uses population parameter (p) called row rather than mean. Alternatively, row is not zero, row is greater than 0, row is less than 0. Scatter plots used to eyeball a correlation. How tight the data is determines how strong the correlation is. Covariance (same definition as correlation): trying to predict one score when you know other scores. It can be as high or as low as positive/negative infinity. Point-biserial: one of your variables has only two levels (dichotomous) and the other is continuous. Partial and semi-partial correlations: takes a closer look at the overlap of certain variables (venn diagram). Partial correlation: extracts extraneous variable from both predictor and criterion. When you partial, you lose degrees of freedom.