Economics 2182A/B Lecture Notes - Lecture 3: Statistical Hypothesis Testing, Confidence Interval, Steakhouse

25 Apr 2018
School
Department
Course
Professor
Document Summary
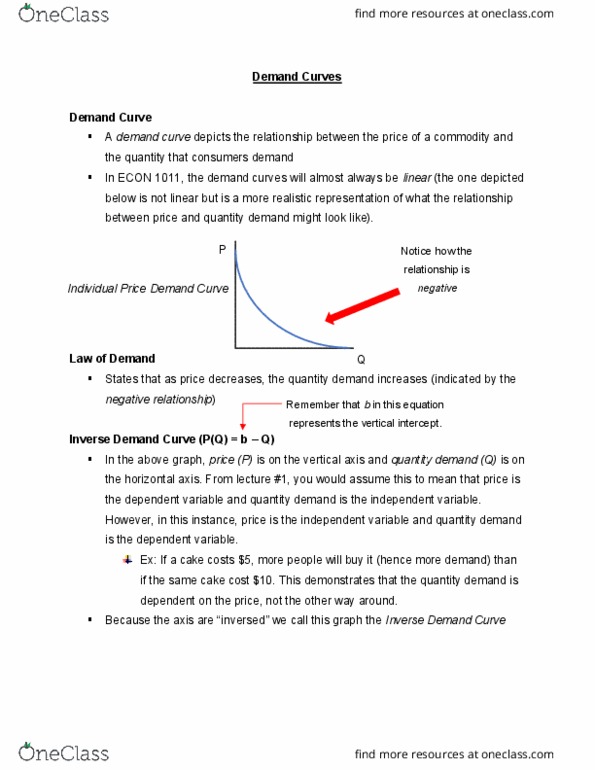
Introduction to linear regression: a demand curve is given by the formula: qd = a - (b x p) B = 600/120 = 5 qd = 600 - 5p. Suppose you own a chain of steak restaurants with each located by an nhl arena. D = (cid:1853) - ((cid:1854) x p) The difference b/w the predicted quantities and the actual quantities is called the residuals. It"s going to minimize the sum of the squared residuals: choose the line that will minimize it. *linear regression excel data info: the estimated demand curve is also called the line of best fit, the actual number of dinner"s when the price is is 793. 4 dinners. So estimated number of dinners is 757. 34 dinners when the price is . 793. 4 (from table at top right) - 757. 3 (estimated) = 36. 1. Confidence interval: we are 95% confident that the actual value of "a" is going to lie b/w.