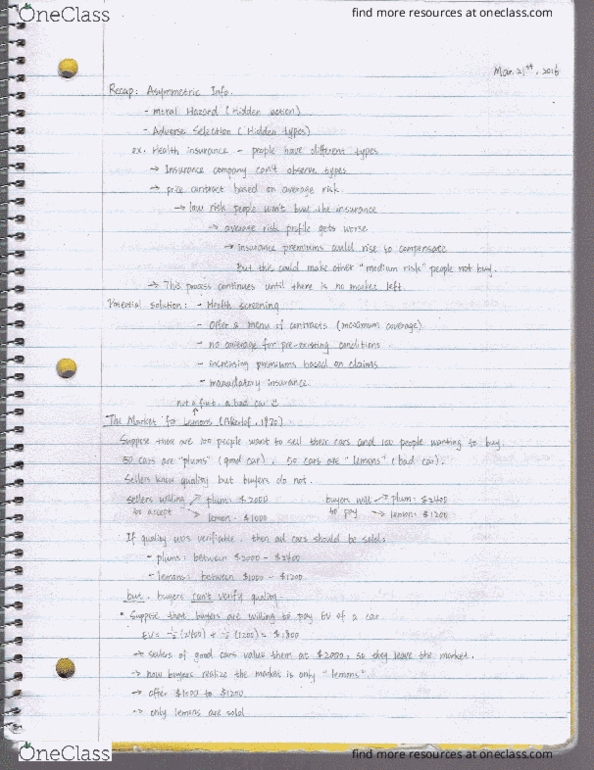
Economics 2261A/B Lecture 14: Mar 1
39 views2 pages

2 Mar 2017
School
Department
Course
Professor
Get access
Grade+20% off
$8 USD/m$10 USD/m
Billed $96 USD annually

Homework Help
Study Guides
Textbook Solutions
Class Notes
Textbook Notes
Booster Class
40 Verified Answers
Class+
$8 USD/m
Billed $96 USD annually

Homework Help
Study Guides
Textbook Solutions
Class Notes
Textbook Notes
Booster Class
30 Verified Answers
Related Documents
Related Questions
Problem 3-17
| New car sales for a dealer in Cook County, Illinois, for the past year are shown in the following table, along with monthly indexes (seasonal relatives), which are supplied to the dealer by the regional distributor. |
| Month | Units Sold | Index | Month | Units Sold | Index |
| Jan. | 635 | 0.70 | Jul. | 795 | 0.90 |
| Feb. | 648 | 0.80 | Aug. | 814 | 1.10 |
| Mar. | 621 | 0.60 | Sept. | 844 | 1.20 |
| Apr. | 733 | 0.94 | Oct. | 825 | 1.20 |
| May | 728 | 0.89 | Nov. | 847 | 1.20 |
| Jun. | 831 | 1.00 | Dec. | 780 | 1.25 |
| b. | Deseasonalize car sales. (Round your answers to the nearest whole number.) |
| Month | Deseasonalized | Month | Deseasonalized |
| Jan. | Jul. | ||
| Feb. | Aug. | ||
| Mar. | Sep. | ||
| Apr. | Oct. | ||
| May | Nov. | ||
| Jun. | Dec. | ||
| e. | What action might management consider based on your findings in part b? | ||||||||
|