Health Sciences 2801A/B Lecture Notes - Lecture 3: Scatter Plot, Sphygmomanometer

29 Sep 2017
School
Department
Course
Professor

Document Summary
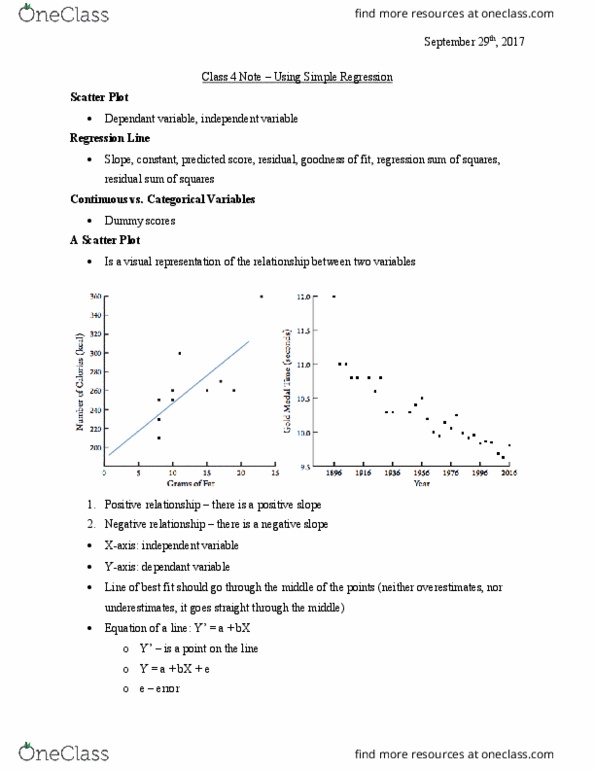
Scatter plot a visual representation of the relationship between two variables. The x-axis is always independent, while the y-axis is always dependent. It is important to draw a line of best fit through the middle of the scatter plot; it must not overestimate or underestimate. The equation of the line of best fit is y" = a + bx. The issue of goodness of fit concerns how well the regression line fits the data; which is assessed by comparing predicted scores (points on the regression line) w/ observed scores. Each observed score has a corresponding point on the regression line. A is the constant, which is the value of y when x=0. Y = a + bx + e (error, what"s left over that needs to be added) The +e should cancel out the e. Divide the ss of the predicted scores by the ss of the observed scores.