Health Sciences 3801A/B Lecture Notes - Lecture 2: Statistical Hypothesis Testing, Sampling Distribution, Normal Distribution

11 Feb 2019
School
Department
Course
Professor

Document Summary
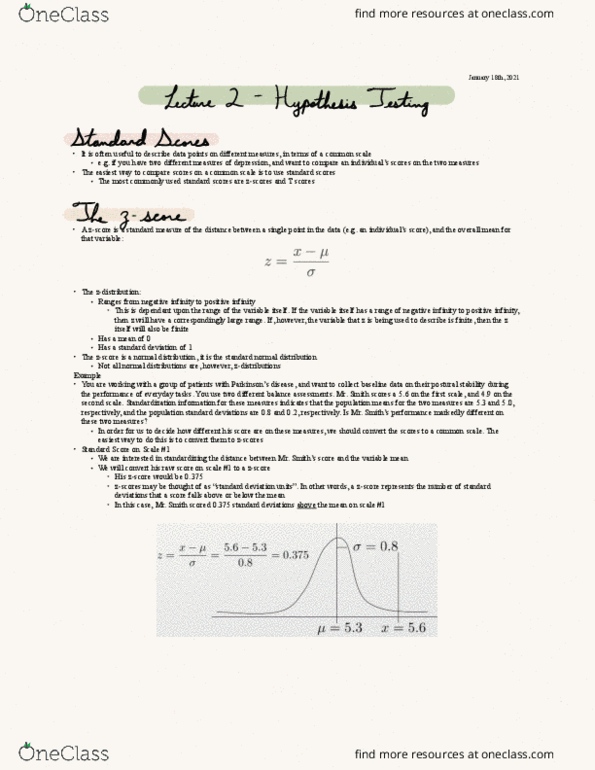
Standard scores: often useful to describe data points on different measures, in terms of a common scale, e. g. , if you have two different measures of depression, and want to compare an individual"s scores on the two measures. The easiest way to compare scores on a common scale is to use standard scores: most commonly, a z-score or t-score. The z-score: a standard measure of the distance between a single point in the data (e. g. , an individual"s score), and the overall mean for that variable: The z-distribution: ranges from negative infinity to positive infinity, has a mean of 0, has a sd of 1. Example: you are working with a group of patients with parkinson"s disease and want to collect baseline data on their postural stability during the performance of everyday tasks. Mr. smith scores a 5. 6 on the first scale and 4. 9 on the second scale.