Health Sciences 3801A/B Lecture 3: Single Sample Inference

11 Feb 2019
School
Department
Course
Professor
Document Summary
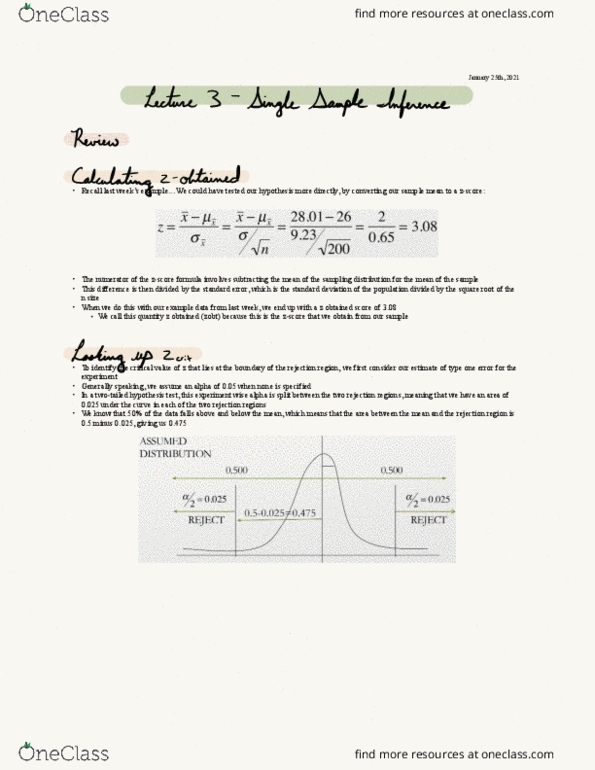
The t-distribution begins to approximate the z-distribution very closely when sample size is 30 or higher. If we used t-test for previous example, the critical value would have changed to 1. 9799. The obtained value compared against this critical value remains the same, even though the formula looks different: Thus, we draw the same conclusions with both tests, and reject the null hypothesis. The effect of sample size: consider the effect of drawing a smaller sample (i. e. , n = 40) The obtained value of z or t shrinks: The difference between z-crit and t-crit also increases z-crit = 1. 96, and t-crit = 2. 0227 (df = 40 1 = 39) This illustrates two things: the probability of rejecting null hypothesis is smaller when using smaller sample sizes, the probability of rejecting null hypothesis is smaller when using t-test rather than z-test. This change in probability is reflective of a difference in statistical power, a concept related to alpha.