Physiology 3120 Lecture Notes - Lecture 18: Pulmonary Artery, Pulmonary Circulation, Circulatory System

11 Aug 2016
School
Department
Course
Professor
Document Summary
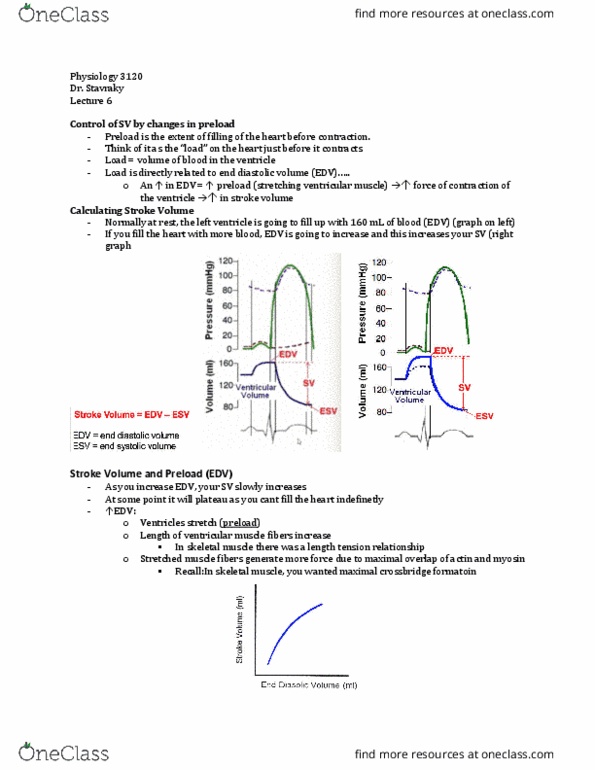
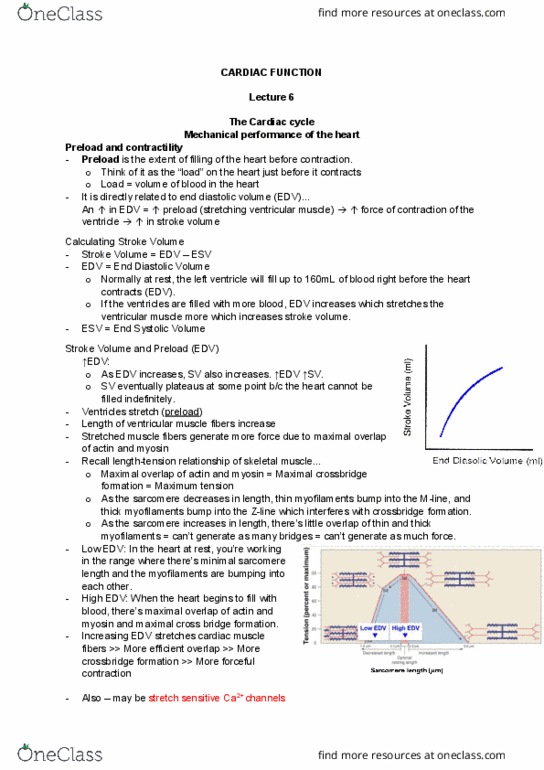
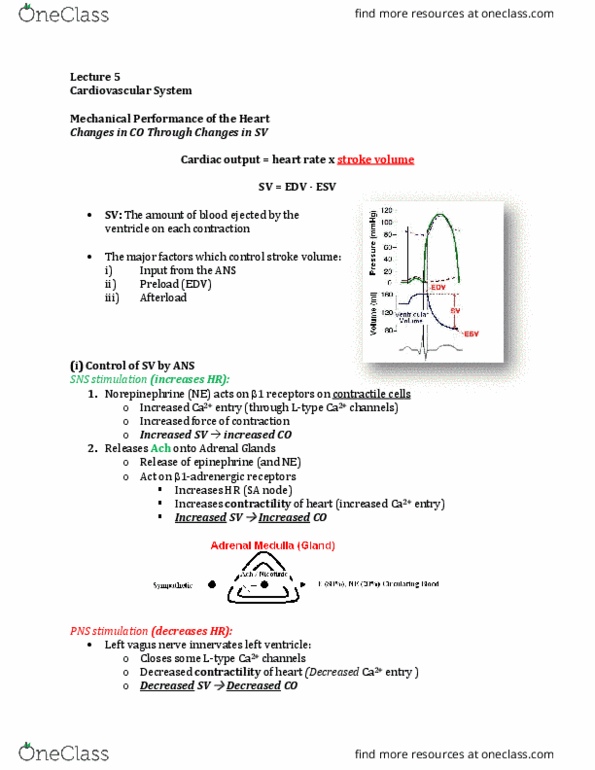
Filling of heart 70% during ventricular diastole 30% during atrial systole. So an increase in edv = more blood going into heart ie: higher preload that stretches out ventricular muscle more. When contractile cells stretch more, they contract more forcefully ie: increase in sv. In volume graph, black shows normal edv and blue shows increased edv. In pressure graph, shows that when stretch more, need to contract just as much so contractile force increases which ejects more blood = higher stroke volume. Graph shows that an increase in edv causes an increase in sv (will plateau at some point) Sarcomeres increase in length which are then able to generate more force due to max overlap of actin/myosin (rmr from org phys overlap = more cross-sectional area = more force generated) When ventricular contractile cells stretch, stretch-sensitive ca channels open, letting in more. Ca which increases contraction force of contractile cells.