Sociology 2206A/B Lecture Notes - Lecture 14: Multivariate Analysis, Analytic Induction, Univariate

19 Apr 2016
School
Department
Course
Professor
Document Summary
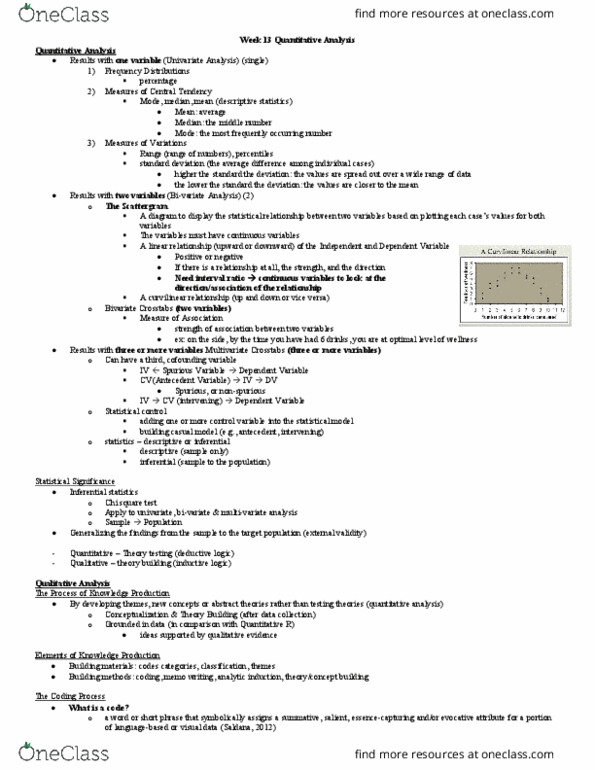
Results with one variable (univariate analysis): frequency distributions. Percentage: measures of central tendency o, mode, median, mean (descriptive statistics), measures of variations, range, percentiles. o. Results with two variables (bi-variate analysis): the scattergram. Standard deviation (the average difference among individual cases). case"s values for both of the variables: a diagram to display the statistical relationship between two variables based on plotting each, a linear relationship (upward or downword). Positive or negative: a curvilinear relationship (up and down or vice versa), measure of association, bivariate crosstabs (two variables) o. Strength of associated between two variables: multivariate crosstabs (three or more variables) o. Statistical control: adding one or more control variable into the statistical model, building casual model (e. g. antecedent, intervening) Inferential statistics: chi square test, apply to univariate, bi-variate, and multi-variate analysis. Generalizing the findings from the sample to the target population (external validity). By developing themes, new concepts or abstract theories rather than testing theories (quantitative analysis).