Statistical Sciences 2244A/B Lecture Notes - Lecture 3: Descriptive Statistics, Statistical Inference, Statistical Hypothesis Testing

22 May 2018
School
Department
Professor

Stats 2244
Lecture 4
Descriptive Statistics
The Discipline of Statistics
- Conducting studies to collect, summarize, analyze, and draw conclusions from data
- Descriptive statistics:
o This is the first step when we have our data
o Organization, summarization, and presentation of data
o Put the data in graph or something like that so you can look at the trends etc
o Can describe the sample or the population
- Inferential statistics:
o Generalization from samples to populations, estimation, hypothesis testing and
prediction making
o Take our sample data and try to infer something about the population comes from
o Start to generalize from our sample results about the greater population
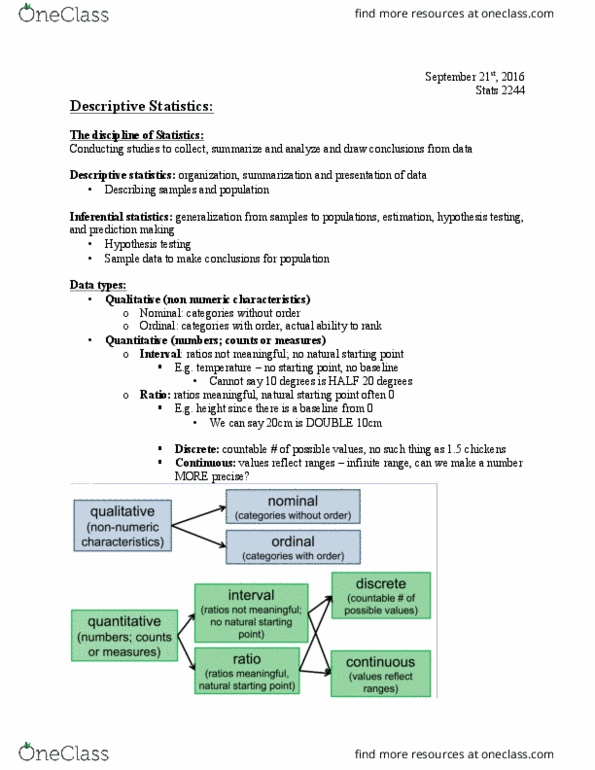
Data Types
- What type of data you collect influences how you summarize that data
- First differentiate whether you have qualitative or quantitative data
- Sometimes qualitative data is #’s but those numbers are placeholders for nonnumerical
characteristics (like asking someone to rate how much they like something from 1-5)
o This is bc you cant do any math on these #’s
- Quantitative data has the potential to record 0 and can be…
o Interval
o Ratio
▪ If that 0 means none then its ratio
▪ You can take 2 values (ex: height of 2 people ) and make a ratio out of those
values, then the ratio is meaningful
▪ If 2 peoples height is 2:1 then it means one is twice as tall as the other
- Ask: are my quantitative data ratio? If not, its automatically interval
- Both interval and ratio data can be discrete or continuous
find more resources at oneclass.com
find more resources at oneclass.com
Document Summary
Conducting studies to collect, summarize, analyze, and draw conclusions from data. Inferential statistics: generalization from samples to populations, estimation, hypothesis testing and prediction making, take our sample data and try to infer something about the population comes from, start to generalize from our sample results about the greater population. First differentiate whether you have qualitative or quantitative data characteristics (like asking someone to rate how much they like something from 1-5) What type of data you collect influences how you summarize that data. Sometimes qualitative data is #"s but those numbers are placeholders for nonnumerical: this is bc you cant do any math on these #"s. Quantitative data has the potential to record 0 and can be . Interval: ratio, you can take 2 values (ex: height of 2 people ) and make a ratio out of those. If that 0 means none then its ratio values, then the ratio is meaningful.