Statistical Sciences 2244A/B Lecture Notes - Lecture 7: Simple Random Sample, Statistical Inference, Statistic

22 May 2018
School
Department
Professor

Stats 2244
Sampling Distributions
Center, Shape (CLT), and spread of x̄
The Discipline of Statistics
Conducting studies to collect, summarize, analyze and draw conclusions from data
- Descriptive statistics:
o Organization, summarization and presentation of data
- Inferential statistics:
o Generalization from samples to population, estimations, hypothesis
testing, and prediction making
o Youre sample differs depending on who you are taking in that sample
o Sampling variability and so statistic variability is what inferential statistics is about
RECALL: Sampling Error
- Difference between a sample statistic and the true population parameter, due to chance sample
differences (not a mistake)
- This graph is showing you that the sample means can take on different values
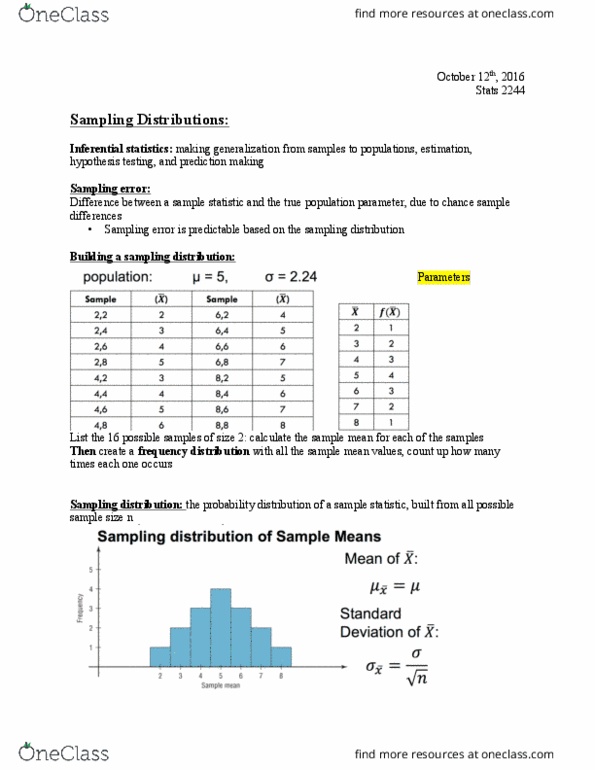
Sampling Distribution
- The probability distribution of a sample statistic, built from all possible samples of size n
o The sample statistic doesnt have to be a mean
o it can be sample medians, sample IQRs etc
- All the values that are a variable can take on and the probability with which they occur
- Xbar is talking about sample means
o Sample means are a random variable!!!!
- If you take simple random samples of size n, then the mean of samples is the same as the
population means
- THE STANDARD DEVIATION OF THE SAMPLING DISTRIBUTION OF SAMPLE MEANS
DECREASES AS THE SAMPLE SIZE OF THE SAMPLES TAKEN INCREASES
- The distance described by the standard deviations of a sampling distribution of sample means
is so its the sampling error for x bar
Selection Bias
- Systematic favouritism in the data selction process, leading to misleading results
- This is why its important to deal with simple random samples, the mean of sampling
distribution of sample means will be equal to the population mean if we are using SRSs
- But if we are not using SRSs, that is not necessarily true
- From now on, assume that we do
- Based on the 192 sample means collected; impossible values and missing data removed:
find more resources at oneclass.com
find more resources at oneclass.com
Document Summary
Conducting studies to collect, summarize, analyze and draw conclusions from data. Descriptive statistics: organization, summarization and presentation of data. Inferential statistics: generalization from samples to population, estimations, hypothesis testing, and prediction making, youre sample differs depending on who you are taking in that sample, sampling variability and so statistic variability is what inferential statistics is about. Difference between a sample statistic and the true population parameter, due to chance sample differences (not a mistake) This graph is showing you that the sample means can take on different values. The probability distribution of a sample statistic, built from all possible samples of size n. Sampling distribution: the sample statistic doesn(cid:495)t have to be a mean it can be sample medians, sample iqrs etc. All the values that are a variable can take on and the probability with which they occur. Xbar is talking about sample means: sample means are a random variable!!!