PS296 Lecture Notes - Cross Product, Central Limit Theorem, Random Variable

Document Summary
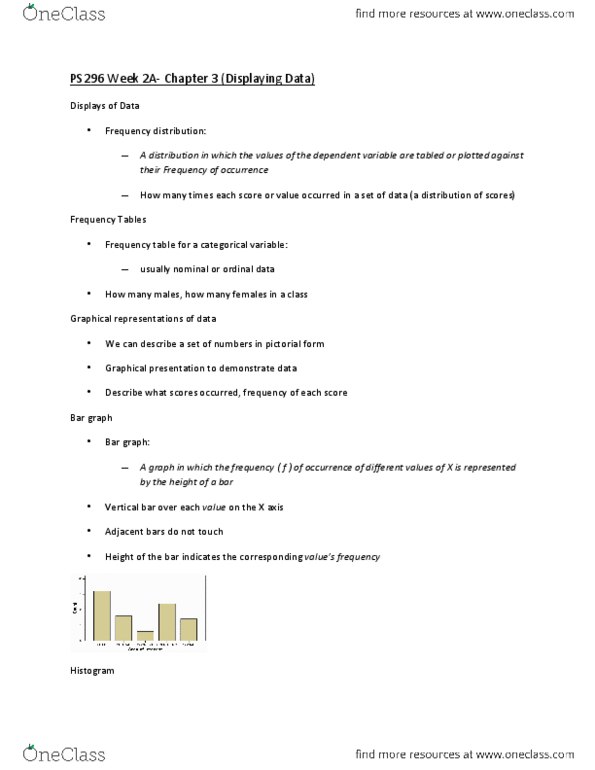
Measurement: assignment of numbers to objects, translating information about attributes or characteristics of cases into numbers. Constant: a number that keeps the same value. Frequency distribution: numbers are plotted in frequency of occurrence, line graph, categorical variable. Bar graph: frequency of occurrence is shown by height of a bar, adjacent bars do not touch. Histogram: similar to bar graph, the rectangles touch, used when variable is interval or ratio. Frequency polygon: replaces bars with points, connected by lines, connect line to x axis. Describe by shape, measures of central tendency (mean, median, mode), measures of dispersion (variability) Uniform, u-shaped, symmetrical, nonsymmetrical: unimodal, bimodal, multimodal, skewness: positively skewed, negatively skewed, j distribution, reverse j distribution, truncated: floor effect, ceiling effect (squeezed against one side or another) Mean: = / n (sum of x"s devided by n), round to two decimal places, mean is gravity point, (mean x n should equal sum of the x"s)