ADMS 2320 Lecture : Ch 10-13

22 Apr 2012
School
Department
Course
Professor

Document Summary
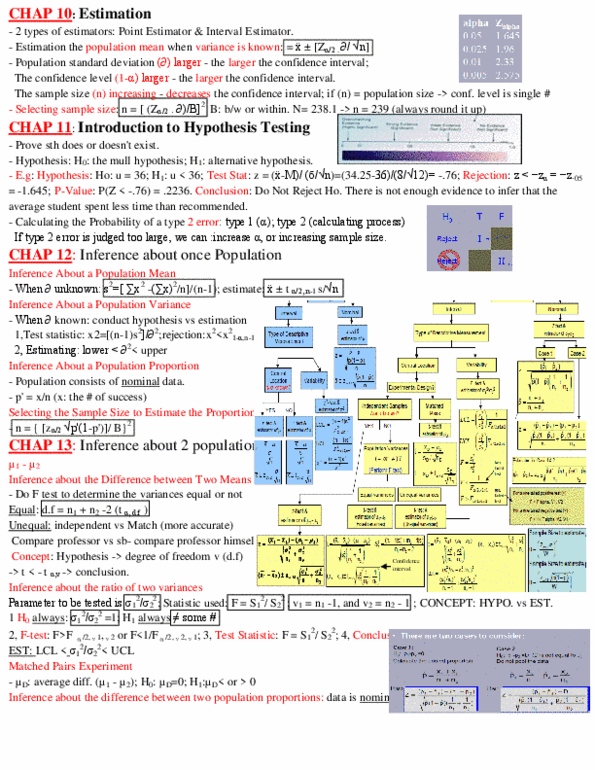
Statistical inferences- acquires info & draw conclusion about population samples. Estimation- value of population parameter of sample statistic. Sample mean (x ) and estimate population mean ( ) 2-types of estimator: point estimator- value of unknown parameter using single value. Do not reflect larger sample size or parameter value: interval estimator (confidence interval)- range of value unknown parameter using intervals, lower/upper confidence limit w/ level of confidence. Unbiased estimator- expected value is equal to parameter e(x ) = (cant tell how close to parameter) Consist estimator- difference btwn estimator & parameter grows smaller as sample gets larger. Relative efficient estimator- 2 unbiased, 1 variance smaller is relative efficient. Larger value of produce wider confidence intervals. Non-statistical hypothesis: null hypothesis- ho: goes against what trying to prove (ex: defendant innocent, alternative (research) hypothesis- h1: trying to prove something (ex: defendant guilty) Type 1 error reject h0 true null hypothesis, most serious (convict innocent person)