ADMS 2600 Lecture 18: Tree Diagrams

16 Feb 2018
School
Department
Course
Professor
Document Summary
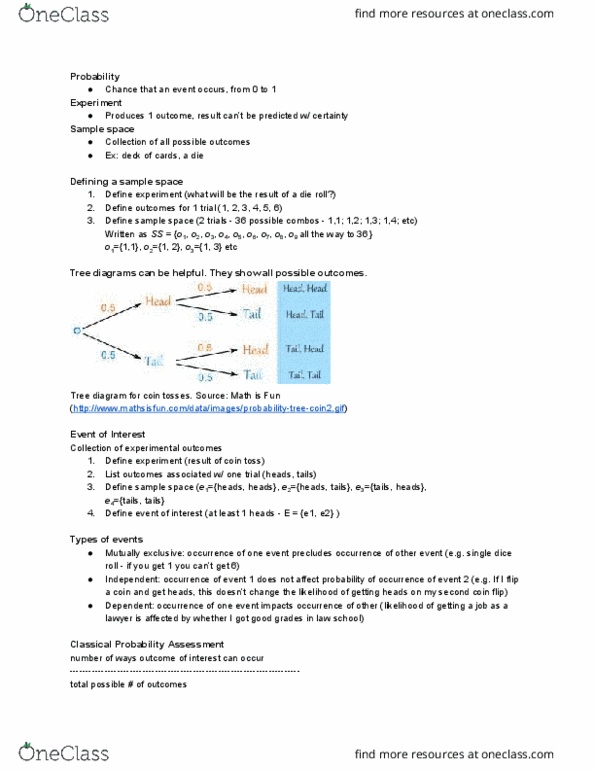
In mathematics, we have a tool for this called a tree diagram. A tree diagram is a tool that we use in general mathematics, probability, and statistics that allows us to calculate the number of possible outcomes of an event, as well as list those possible outcomes in an organized manner. A common example used to introduce tree diagrams is to find the number of possible outcomes of flipping two coins in succession. We know that when we flip a coin, it will either land on heads or tails, so when we flip one of the coins, we have two possible outcomes: heads or tails. When creating a tree diagram, we would represent this by having a starting point, then we would draw two branches from that starting point: one for heads and one for tails. Now, when we flip the second coin, it can land on either heads or tails.