MGMT 1050 Lecture Notes - Lecture 3: Unimodality, Histogram, Frequency Distribution

14 Mar 2018
School
Department
Course
Professor
Document Summary
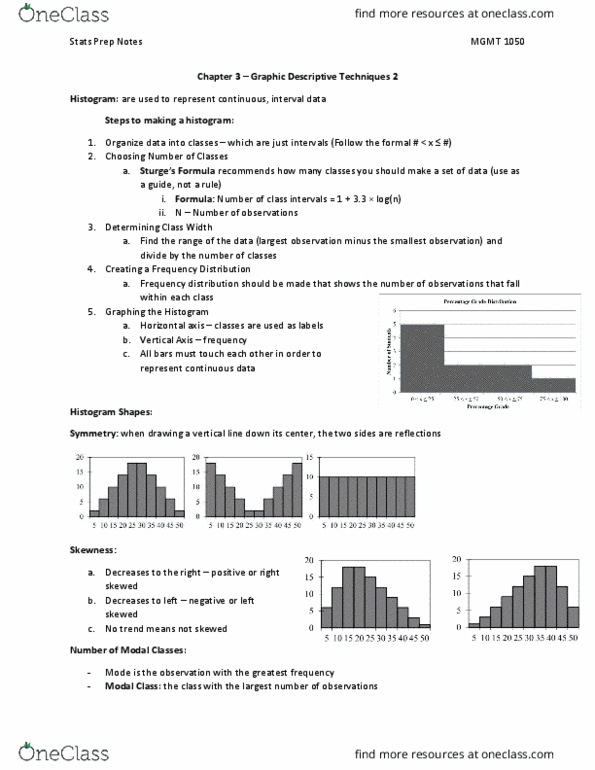
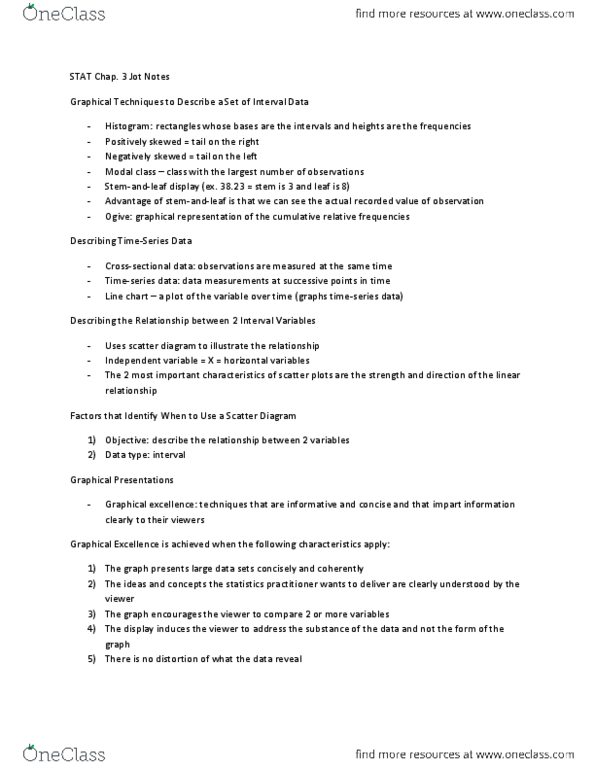
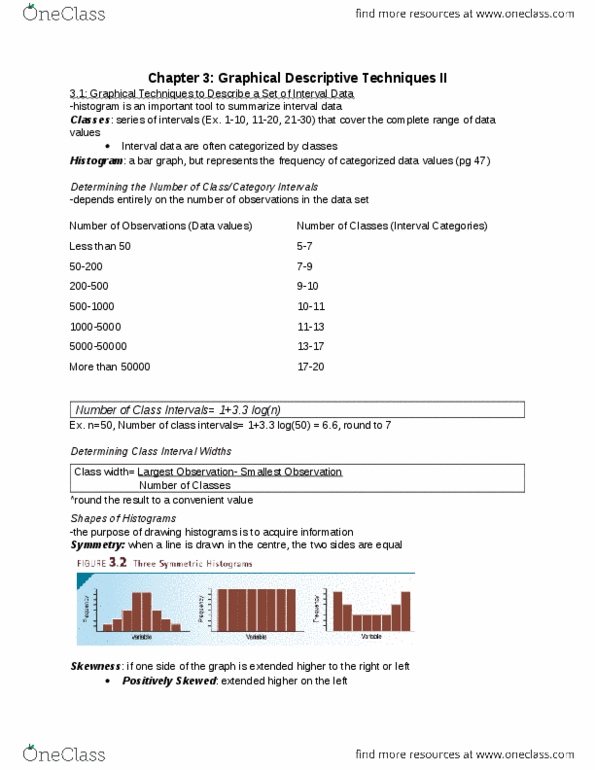
3. 1 graphical techniques to describe a set of interval data. Classes (categories) contain observations greater than their lower limits. Histogram: created by drawing rectangles whose bases are the intervals and whose heights are the frequencies. Drawback: lose potentially useful information by classifying the observations. Focuses our attention on the frequency of each class and sacrifices whatever information was contained in the actual observations. Depends entirely on the number of observations in the data set. More observations, more class intervals needed to draw useful histogram. Number of class intervals = 1 + [ln(n)/ln(2)] Class width = (largest observation smallest observation)/number of classes. Table 3. 2 and sturge"s formula are guidelines only, more important to choose classes that are easy to interpret. Symmetry a histogram is symmetrical when the two sides are identical in shape and size if a vertical line is drawn at the centre. Skewness long tail extending either right or left.