MGMT 1050 Lecture Notes - Lecture 9: Central Limit Theorem, Sampling Distribution, Statistic

14 Mar 2018
School
Department
Course
Professor
Document Summary
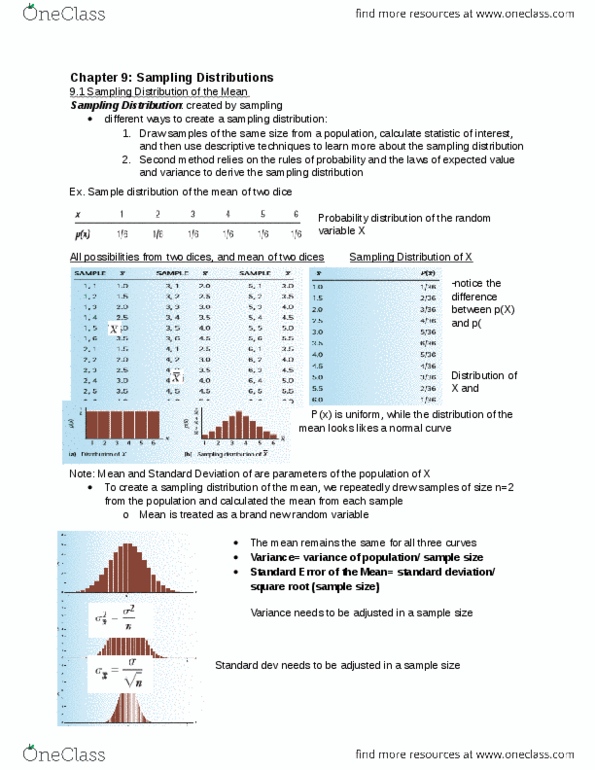
Draw samples of the same size from a population, calculate statistic, use descriptive. Second method relies on rules of probability and the laws of expected value and variance to techniques derive the sampling distribution. And 2 are the parameters of population of x. To create the sampling distribution of x we repeatedly drew sample from the population and calculated x for each sample. Thus, we treat x as a brand new random variable, with its own distribution, mean and variance. The mean is denoted as x and the variance as 2. Standard error of the mean: x = / n x = 2/n x. A randomly selected value of x is more likely to be closer to than a randomly selected value of x. Sampling distribution of x becomes narrower as n increases. Shape also becomes more bell shaped as n increases.