NATS 1500 Lecture Notes - Lecture 17: Contingency Table, Dependent And Independent Variables, Southern California

4 Oct 2016
School
Department
Course
Professor

Document Summary
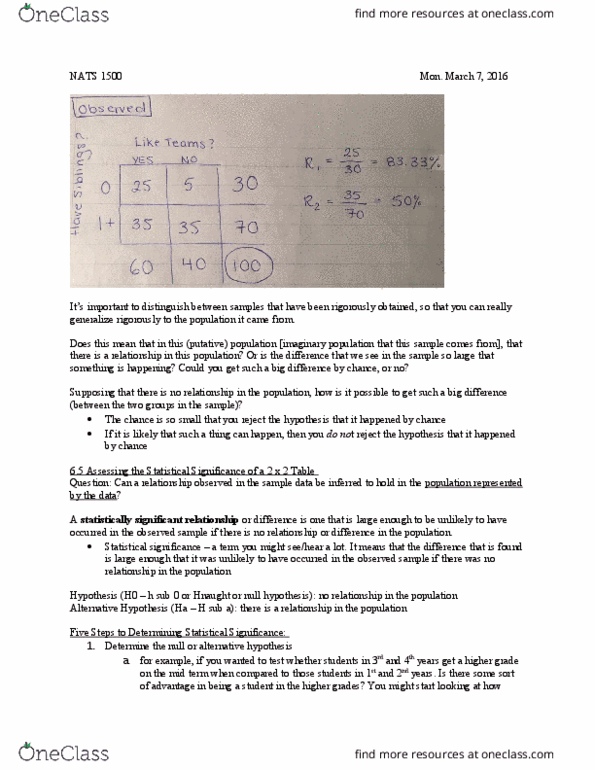
** the entire course will be on the final ** This is just a re-cap of last week"s lecture on covariance. Scatter plot would not be a good way of showing the relationship. You would have to use a contingency table. Data displayed in a contingency or two-way table. If one variable is explanatory, use it to define the rows of the table. Two type of conditional percents: row percents and column percents. Use row percents it the explanatory variable is the row variable. Example: say you have 100 people in the class, and you ask them if they have siblings or not, and also ask them whether or not they like working in teams. In this case, you could have a range of responses, but you want yes or no answers. In this 2 by 2 table, you have totals (rows, columns, and grand).