PSYC 2021 Lecture 2: Lecture 2-Freq Distributions

9 Mar 2017
School
Department
Course
Professor

Document Summary
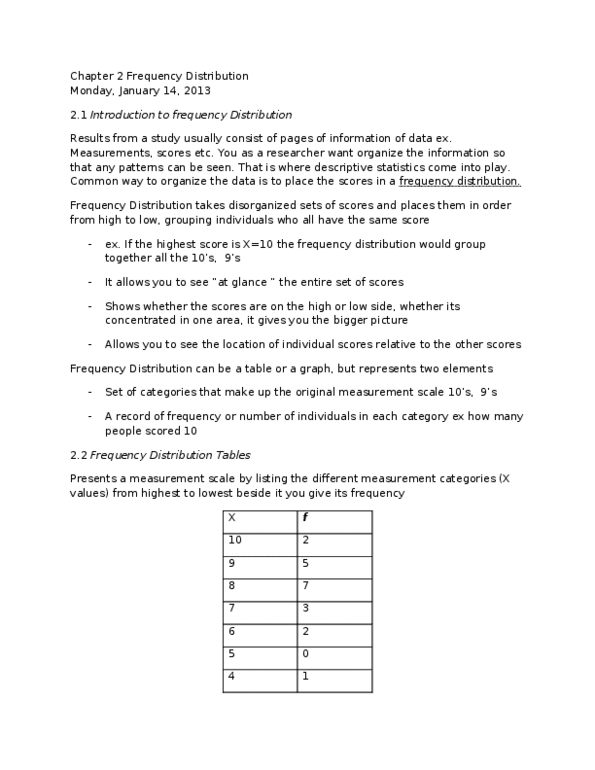
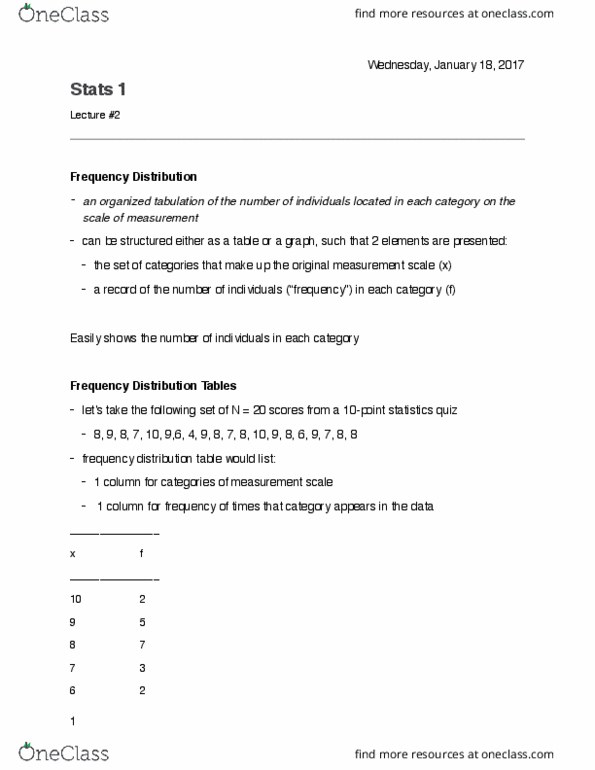
2. ) a record of the frequency, or number of individuals in a category. The simplest form of frequency distribution tables presents the measurement scale by listing the difference categories (x values) in a column ranging from highest to lowest, then beside each category the frequency is indicated(values). 1. ) the highest score is x=10, and the lowest score is x=4. The first column of the table lists the categories that make up the scale of measurement (x values) from. 2. ) the frequency associated with each score is recorded in the second column (f). The table now organizes the scores, it is possible to see the results of the quiz. The x values in the frequency distribution table represents the scale of measurement and not the actual set of scores. F=n (the number of people that took the test or number of people in the entire study) in this example.