PSYC 2030 Lecture Notes - Lecture 6: Partial Correlation, Scatter Plot, Institute For Operations Research And The Management Sciences

20 Feb 2018
School
Department
Course
Professor
Document Summary
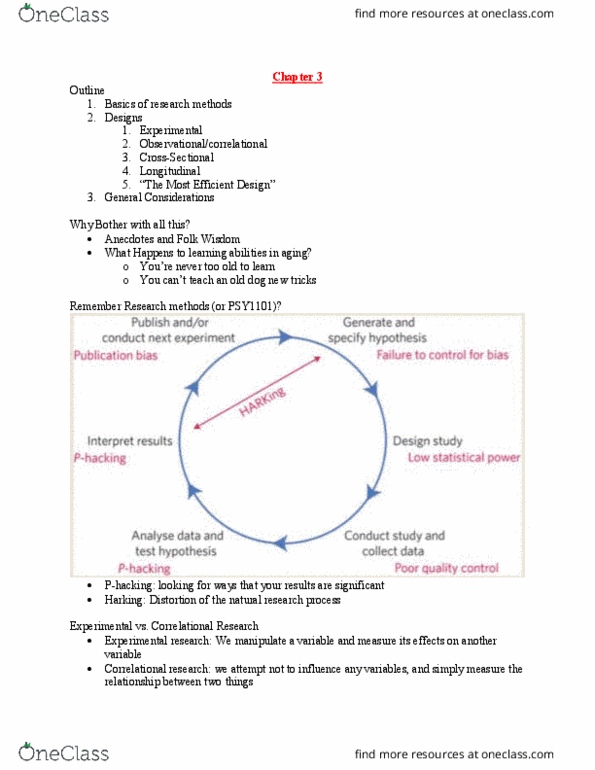
Trye of effect sizes of emperimental methods as well. It"s about gradual accumulation of research - lots of people doing lots of different studies what are things that make people happy. You can convert between effect sizes - cohen"s d - r. You come back to the same place where you started. One of the ways you can detect if you have a non linear relationship is by looking at the scatter plot. Lack of causality isn"t a fatal flaw - experimental method is the only method we have that allows to make inferences about causality - doesn"t mean data is useless. Correlation is necessary, but not sufficient, for causality. Height and shoe size - positively correlated. In research it is addressed in many ways: Trying to think of, what are those third variables that could plausibly explain this relationship. Controlling for potential third variables through partial correlation or multiple regression.