STAT W 1111x Lecture Notes - Lecture 20: Simple Random Sample, Stratified Sampling, Sampling Frame

25 Aug 2016
School
Department
Course
Professor
Document Summary
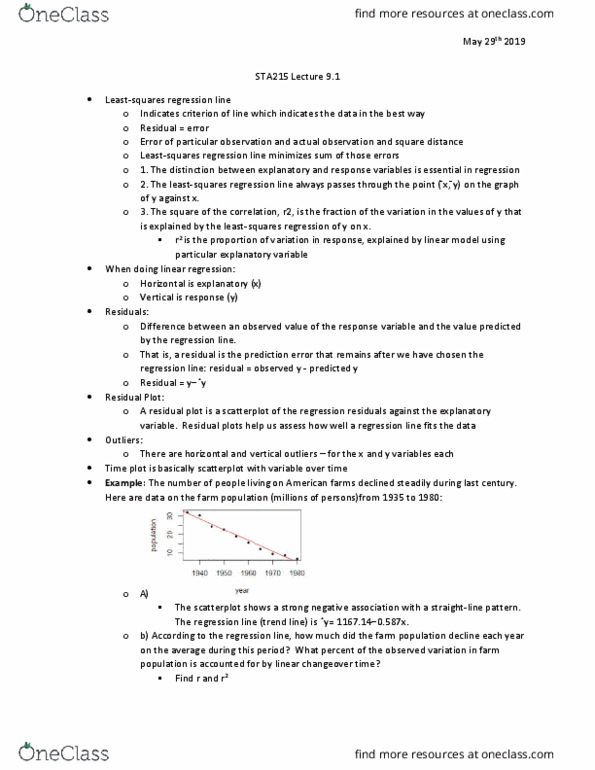
7. 4 regression to the mean ** go over ** Residual = observed value predicted value (e = y yhat) Residual v. x value scatterplot should appear to have no shape and a constant spread. # of residuals v. residual scatterplot should appear to be unimodal and symmetric in a histogram. 7. 6 r^2 the variation accounted for by the model **go over** If r^2 is closer to 1 the model is more useful: r^2 = 1 is a perfect fit. If r^2 is closer to 0 the model is less useful. R^2 value indicates how much variation can be accounted for by the model. Quantitative variables condition: both variables must be quantitative. Condition: does the spread of data around the generally straight relationship seem to be consistent for all values of x. Sometimes it is necessary to regraph scatterplots with residuals to look for the straight enough condition.