COMPSCI C8 Lecture Notes - Lecture 27: South Dakota Highway 10, Confidence Interval, Sample Size Determination

14 Mar 2018
School
Department
Course
Professor
Document Summary
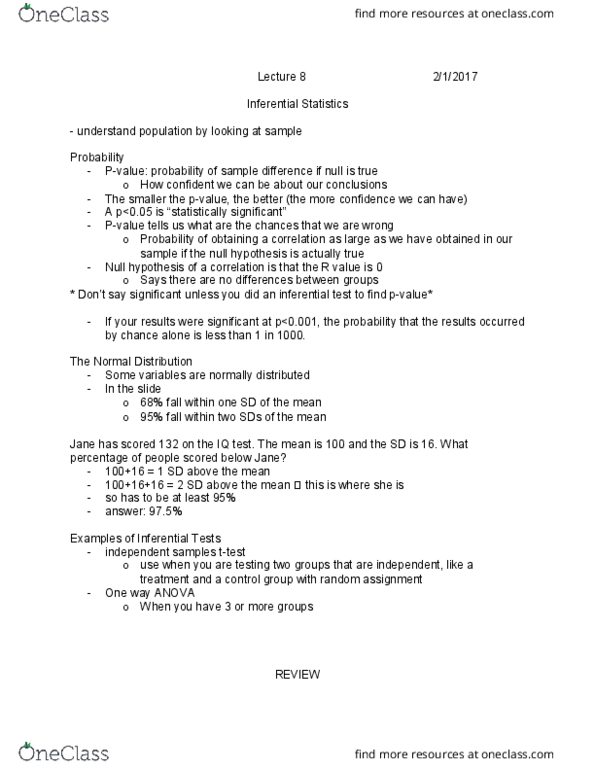
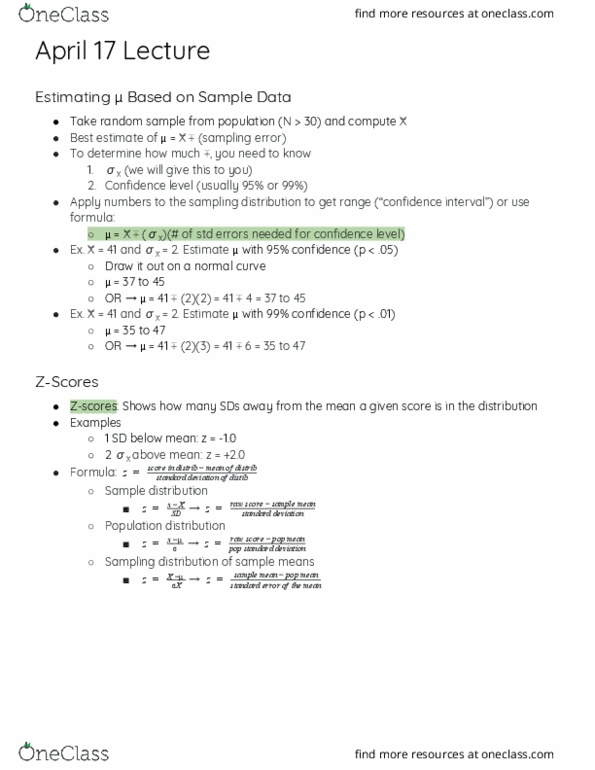
Population: incomes with mean k & sd k. Key fact from last time: sample mean sd = pop sd / sqrt n. Sd of sample mean: population sd / 10 = k. So, k is 2 sd above the population mean. About 95% are within sd of the population mean. About 2. 5% are above; about 2. 5% are below. Sample: 100 chosen uniformly at random with replacement. 50 is 2 population sd above the population mean. The chance of drawing one value below 50 is 97. 5% The chance of drawing 100 below 50 is 0. 975 ** 100. Clt says the distribution of a sample proportion is roughly normal, centered at population proportion. 95% confidence interval: center +- 2 sds of the sample proportion. Total width: 4 sds of the sample proportion: = 4 x (sd of 0-1 population) / sqrt(sample size) Suppose you"re ok (cid:449)ith the (cid:449)idth (cid:271)ei(cid:374)g up to (cid:1007)%