POL SCI 1 Lecture Notes - Lecture 9: Intel 8089, Job Satisfaction, Rich Dad Poor Dad

18 Sep 2017
School
Department
Course
Professor
Document Summary
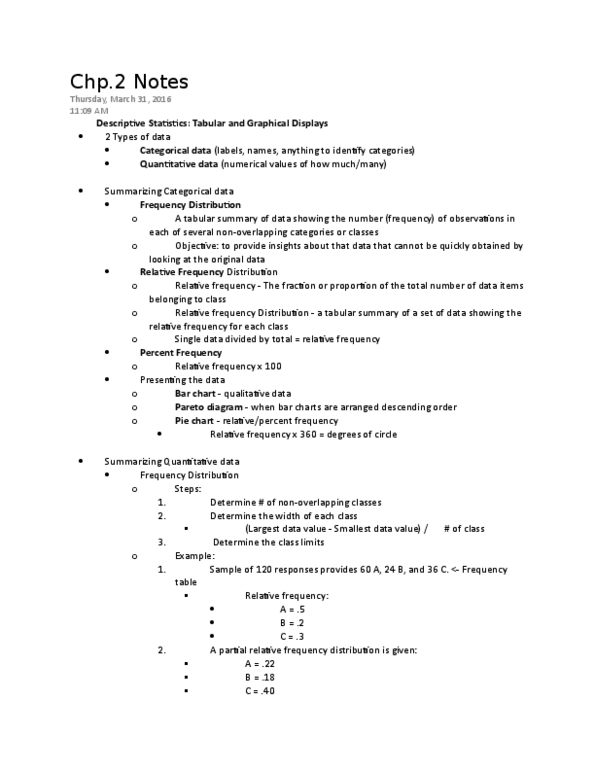
Learn how to construct and interpret summarization procedures for qualitative data such as : frequency and relative frequency distributions, bar graphs and pie charts. Learn how to construct and interpret tabular summarization procedures for quantitative data such as: frequency and relative frequency distributions, cumulative frequency and cumulative relative frequency distributions. Learn how to construct a dot plot, a histogram, and an ogive as graphical summaries of quantitative data. Be able to use and interpret the exploratory data analysis technique of a stem-and-leaf display. Learn how to construct and interpret cross tabulations and scatter diagrams of bivariate data. 100: 360 x 58/120 = 174 , 360 x 42/120 = 126 . 48: millionaire has the largest market share. 64% of the ratings are very good to outstanding. 84% of the ratings are good or better. Comparing these ratings with previous results will show whether or not the restaurant is making improvements in its ratings of food quality.