STAT 20 Lecture Notes - Lecture 29: Shoe Size, Percentile Rank

26 Oct 2018
School
Department
Course
Professor
STAT 20 verified notes
29/46View all
Document Summary
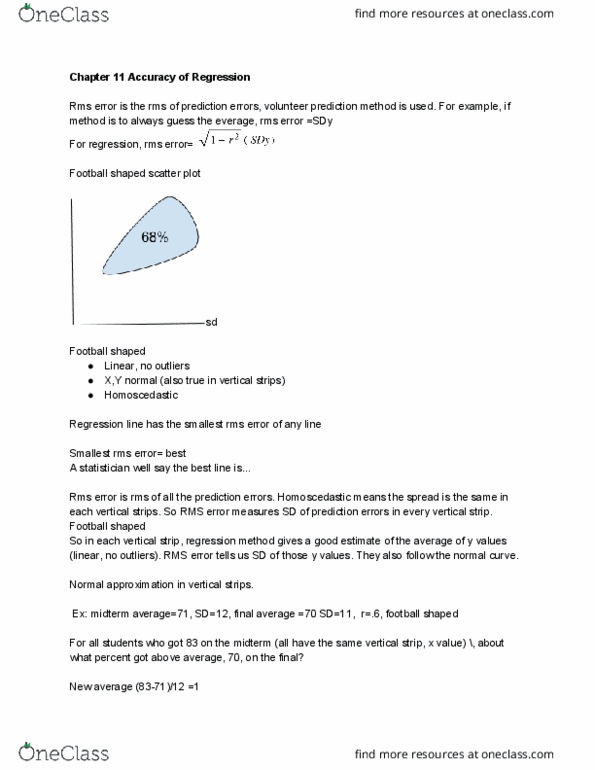
Predicted tan length in sd for someone one sd above average for x. There is still a regression line for non-linear regressions, but it is not a good predictive tool. Regression method: convert x to su, multiply by r (predicted y in su, convert out of su. If linear, no outliers, graph of averages closely follows reg line. Reg line is a smooth version of the graph of averages. Midterm average =71 sd=12 final average=70 sd=11, r=. 6. Predicted score for someone who got an 83 on the midterm. There are two types of regressions: predicts y from x, predicts x from y. If you switch methods you have to completely start from scratch, you cannot use the data from the previous method. The reason we need to work in standard units is because the contrasting units are different. We cannot equate inches directly to pounds for example. Ex: msat scores and stat 20 total points r=. 6 football shaped.