STAT W21 Lecture Notes - Lecture 10: Scatter Plot, Heteroscedasticity, Asteroid Family

Document Summary
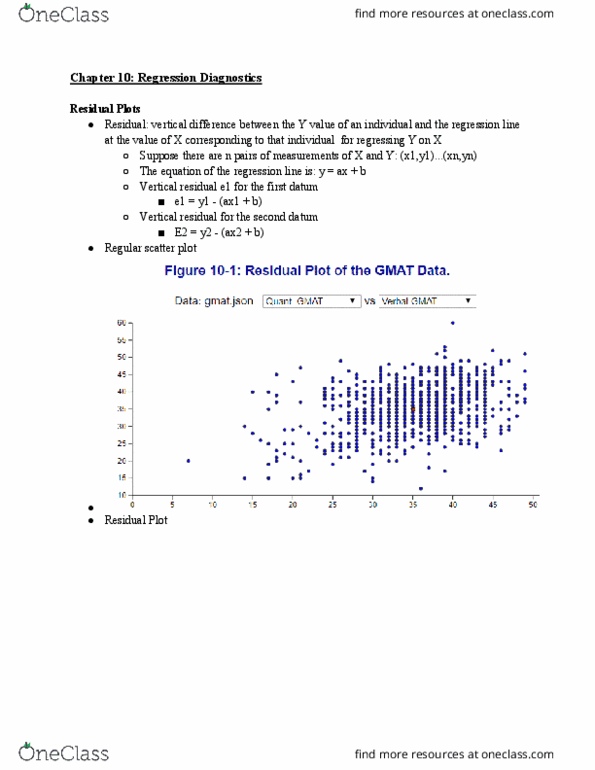
Residual: vertical difference between the y value of an individual and the regression line at the. Regression is a poor summary of data that have heteroscedasticity, nonlinear association, or outliers. A residual plot shows outlier only if the original data contain outliers, but it is easier to see them in the residual plot. Residual plots make some aspects of the data easier to see: too. Residuals have heteroscedasticity, nonlinearity or outliers only if the original . It is easier to see heteroscedasticity, nonlinearity, and outliers in a residual plot than in a. Heteroscedasticity shows up in a residual plot as a difference in the scatter of the. Outliers show up in a residual plot as unusually large positive or negative values. A residual plot shows at a glance whether the regression line was computed correctly. If the residuals have a trend, the slope of the regression line was miscalculated.