MATH 1150 Lecture Notes - Lecture 5: Unimodality, Bar Chart, Categorical Variable

3 Feb 2017
School
Department
Course
Professor
Document Summary
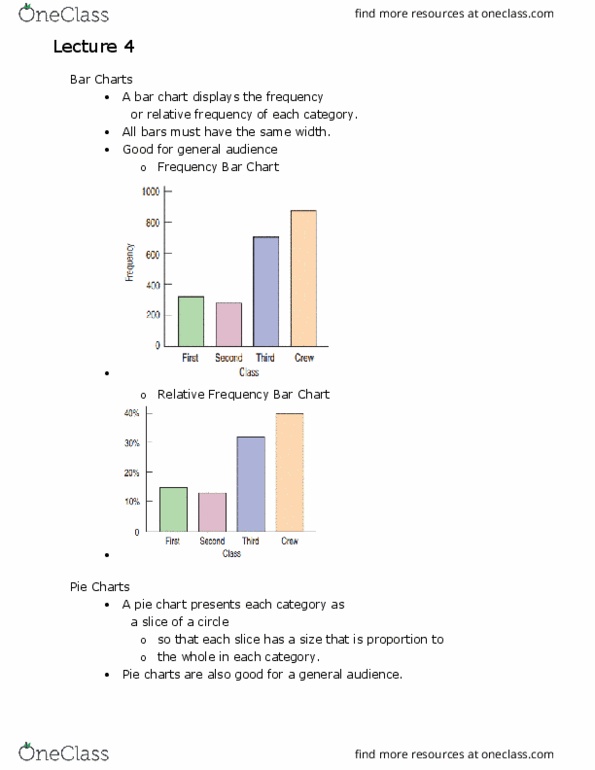
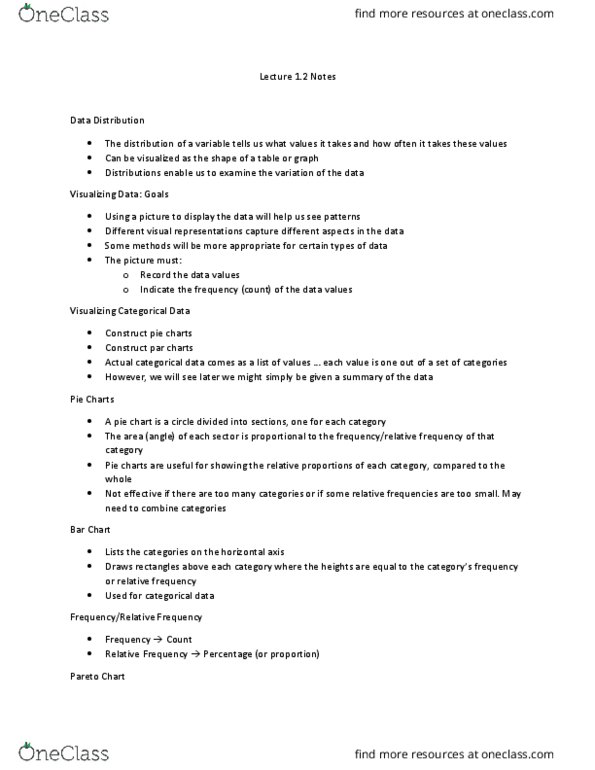
Categorical charts include bar and pie charts: bar graphical summary of categorical data. Height of each bar is proportional to the frequency of that category. Pareto chart char that orders categories by most to least. Ordering by frequency is most favored: pie chart displays categorical data as a circle. Each slice in the circle is proportional to the frequency of the data. Bar charts versus histograms: bar charts: The bars do not touch because they are different categories. Width of bar does not mean anything. The order of the bars does not matter: histogram: Bin width tells us what numbers fall in that bin. Must be in numerical order so graph shape makes sense. Bins can touch, a space represents a gap in the data (aka outliers). Mode - the most frequent category: when a bar is higher than the rest, it is unimodal, when two bars are both the same number, it is considered bimodal.