MATH 1150 Lecture Notes - Lecture 6: Standard Deviation

4 Feb 2017
School
Department
Course
Professor
Document Summary
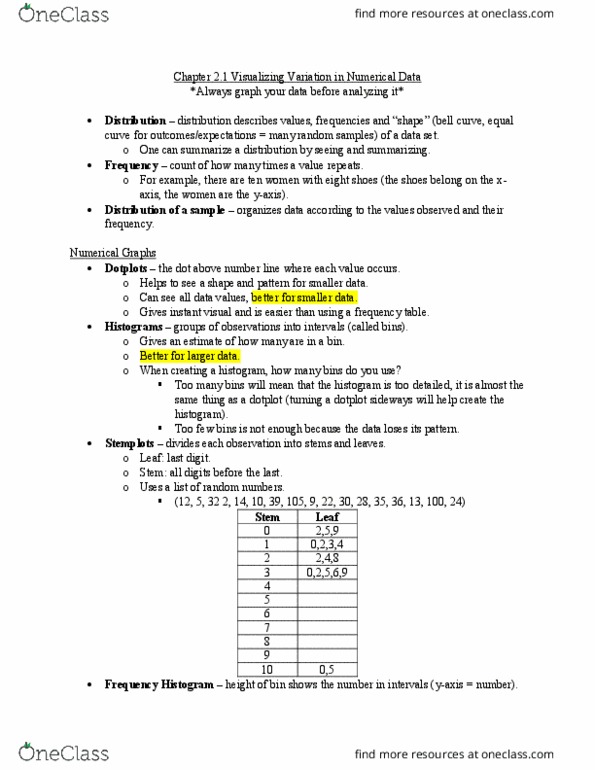
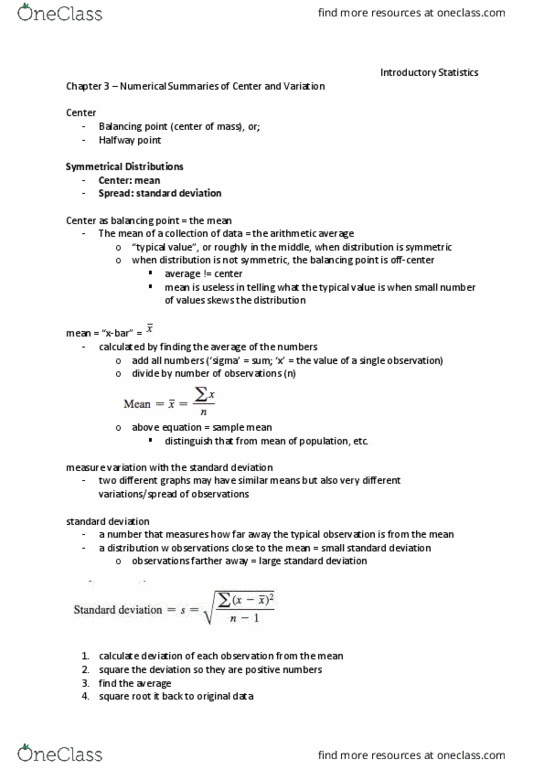
Chapter 3. 1 numerical summaries of center and variation. The center tells us the typical value: the measures depend on the shape. For symmetric graphs, we want to use the mean and standard deviation to measure the center. Mean average or the point that balances the graph: the mean will be found at the center for a symmetric distribution. Many times, it will also be close to the center: the average and typical value for a skewed distribution will be different. Typically we don"t use the mean in a skewed distribution because it doesn"t tell us much (not numbers we are meant to use) The direction of the skew is the direction the average will get pulled in. Left skew: the mean is a lower number than the center. Right skew: the mean is a higher number than the center. We will often use the average for the center in symmetric distributions: interpreting the mean: explain.