CAS MA 113 Lecture Notes - Lecture 5: Categorical Variable, The Stems, Frequency Distribution

12 Feb 2018
School
Department
Course
Professor
Document Summary
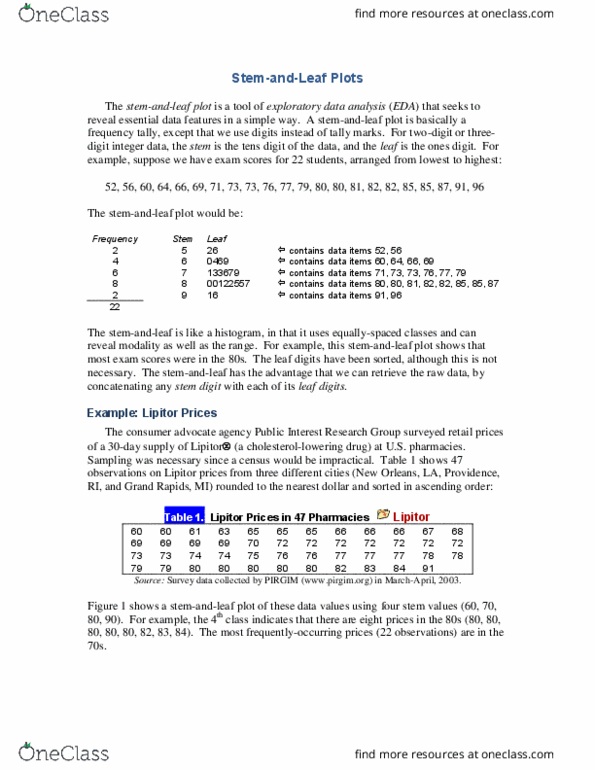
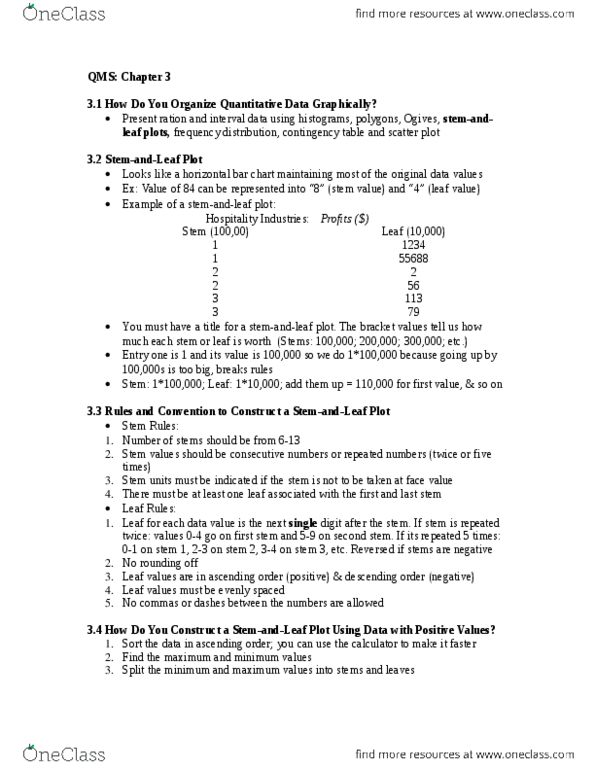
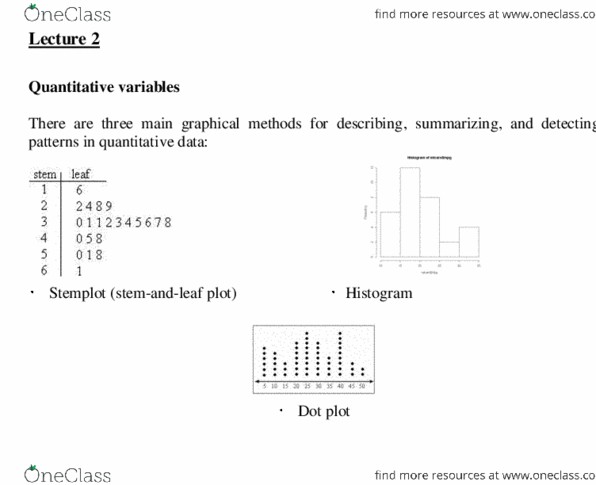
Cas ma 113- lecture 5 notes- stem plots and categorical data. A stem and leaf table is another way to show a frequency distribution. The stems are similar to classes in a frequency distribution. Each stem is a single digit, representing one units place higher than the leaf for each data point. The leaves represent the individual data points: the leaf numbers are a lower units place than the stem. The legend at the bottom of the table shows the units places used: a reader may use this to understand how to extract data point values from the table. Example: after an exam, a professor wants to organize the class" raw scores (out of 100 possible points) into a stem plot to determine letter grade ranges. The class" scores are listed: 3, 7, 12, 15, 40, 46, 54, 56, 57, 57, 68, 89, 94, 96, 100.