CAS MA 115 Lecture Notes - Lecture 2: Frequency Distribution, Regional Policy Of The European Union, Pie Chart

1 May 2018
School
Department
Course
Professor

CHAPTER 2 – ORGANIZING AND SUMMARIZING DATA
Section 2.1 – Organizing Qualitative Data
Objective 1: Organizing Qualitative Data in Tables
• Data collected must be organized in tables/graphs/numerical summaries
• Raw Data – unorganized data
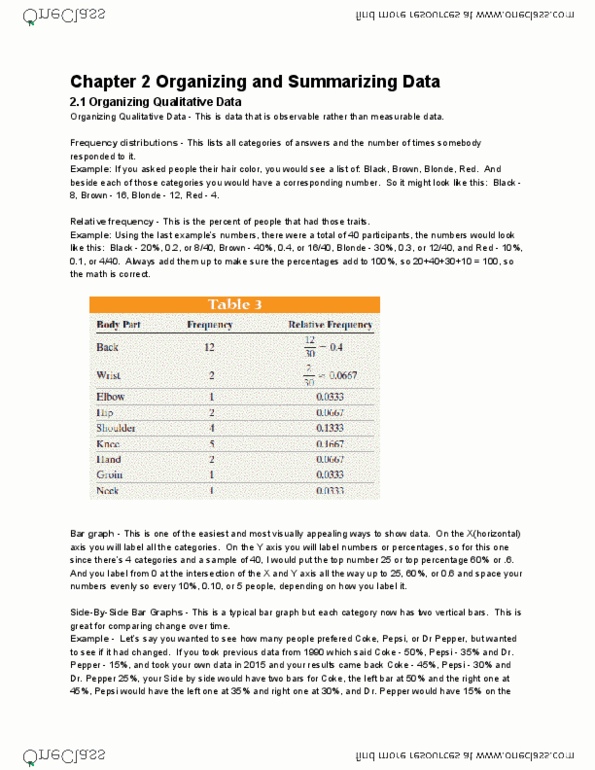
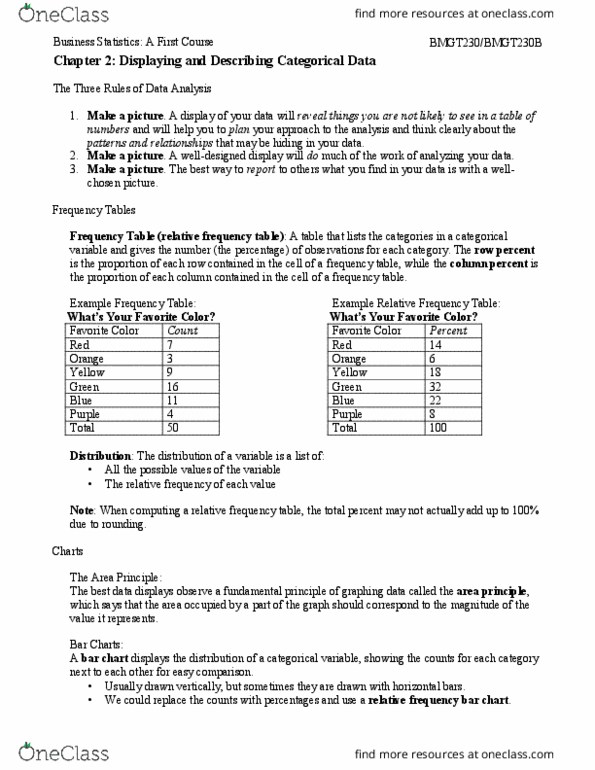
• Frequency Distribution – categorizes data while tallying each occurrence respectively
o ex: number of M&Ms in a bag: 12 brown, 10 yellow, 9 red, 6 green, 4 blue
• Relative Frequency – the proportion (percent) of observations within a category
o Formula =
• Relative Frequency Distribution – lists each category of data with its relative frequency
o ex: number of M&Ms in a bag: 0.267 (12/45) brown, 0.222 (10/45) yellow, 0.2
(9/45) red, 0.133 (6/45) green, 0.067 (4/45) blue
Objective 2: Organizing Qualitative Data in Tables
• Bar Graph – a graph constructed by labeling each category of data on either the
horizontal/vertical axis while the frequency/relative frequency of the category is on the
opposite axis. Rectangles of equal width depict each category while the height of each
represents the frequency/relative frequency of the category
o ex: number of M&Ms in a bag: Frequency v. Relative Frequency Bar Graph
find more resources at oneclass.com
find more resources at oneclass.com

• Pareto Chart – a bar graph where bars are drawn in order of decreasing frequency/relative
frequency
o ex: number of M&Ms in a bag: Relative Frequency Pareto Chart
• Side-By-Side Bar Graphs – compare the data from two different times by relative
frequencies rather than frequency (as different sample/population sizes makes
comparisons misleading)
• Horizontal Bars – bar graphs drawn horizontally, usually when category names are
lengthy
Objective 3: Constructing Pie Charts
• Pie Chart – a circle divided into sectors, with each sector representing a data category
while the area of each sector is relative to the frequency of the category (meaning that the
bigger the section is, the more frequent it is and vice versa)
Section 2.2 – Organizing Quantitative Data
Objective 1: Organizing Discrete Data in Tables
• Steps to summarize quantitative data
o 1. Determine whether the data is discrete or continuous
o 2. If the data is discrete and there are not too many different values of the
variable, the categories of data (classes) will be listed as observations
o 3. If the data is discrete but there are many different values of the variable, the
categories of data (classes) will be listed using intervals of numbers
o 4. If the data is continuous, the categories of data (classes) will be listed using
intervals of numbers
• ex: constructing a frequency/relative frequency distribution of the number of cars in a
household
o What type of quantitative data is this? Discrete data with few classes.
find more resources at oneclass.com
find more resources at oneclass.com
Document Summary
O formula = (cid:3033)(cid:3045)(cid:3032)(cid:3044)(cid:3048)(cid:3032)(cid:3041)(cid:3030) (cid:3046)(cid:3048)(cid:3040) (cid:3042)(cid:3033) (cid:3028)(cid:3039)(cid:3039) (cid:3033)(cid:3045)(cid:3032)(cid:3044)(cid:3048)(cid:3032)(cid:3041)(cid:3030)(cid:3032)(cid:3046) Objective 2: organizing qualitative data in tables: bar graph a graph constructed by labeling each category of data on either the horizontal/vertical axis while the frequency/relative frequency of the category is on the opposite axis. Objective 1: organizing discrete data in tables: steps to summarize quantitative data, 1. Determine whether the data is discrete or continuous: 2. If the data is discrete and there are not too many different values of the variable, the categories of data (classes) will be listed as observations: 3. If the data is discrete but there are many different values of the variable, the categories of data (classes) will be listed using intervals of numbers: 4. Objective 3: organize continuous data in tables: classes categories where data is grouped, used when data sets consist of several different discrete data values or continuous data. Stems and leafs are identified and clarified in the legend: 2.