CAS MA 115 Lecture Notes - Lecture 9: Confidence Interval, Simple Random Sample, Point Estimation

1 May 2018
School
Department
Course
Professor

CHAPTER 9 – ESTIMATING THE VALUE OF A PARAMETER
Section 9.1 – Estimating a Population Proportion
Objective 1 – Obtain a Point Estimate for the Population Proportion
• Point Estimate – the value of a statistic that estimates the value of a parameter
o Important to note that this measure is not as accurate as other methods
• The point estimate for the population proportion is p^ =
with x representing the number
of individuals in the sample with a specified characteristic and n representing the sample
size
o ex: obtain a point estimate for the proportion of registered voters nationwide who
are in favor of the death penalty for persons convicted of murder if 1123
registered voters out of 1783 were in favor.
o p^ =
= 0.63
Objective 2 – Construct and Interpret a Confidence Interval for the Population Proportion
• Confidence interval – an interval of numbers based on a point estimate
o Formula = Point Estimate +/- Margin of Error
o Interpretation: (1 – ) x 100% indicates that (1 – ) x 100% of all simple random
samples of size n from the population whose parameter is unknown will result in
an interval that contains the parameter
o ex: a confidence interval of 90% means that we are 90% confident that the
population parameter will fall within the interval (__,__)
• Margin of Error – measures how accurate a point estimate is
o Depends on:
▪ Level of Confidence – as this increases the margin of error increases
▪ Sample Size – as this increases, the margin of error decreases
▪ Standard Deviation of the Population – the wider spread out this is the
wider the interval for confidence will be
o Key Words: within ___grams/percentage points
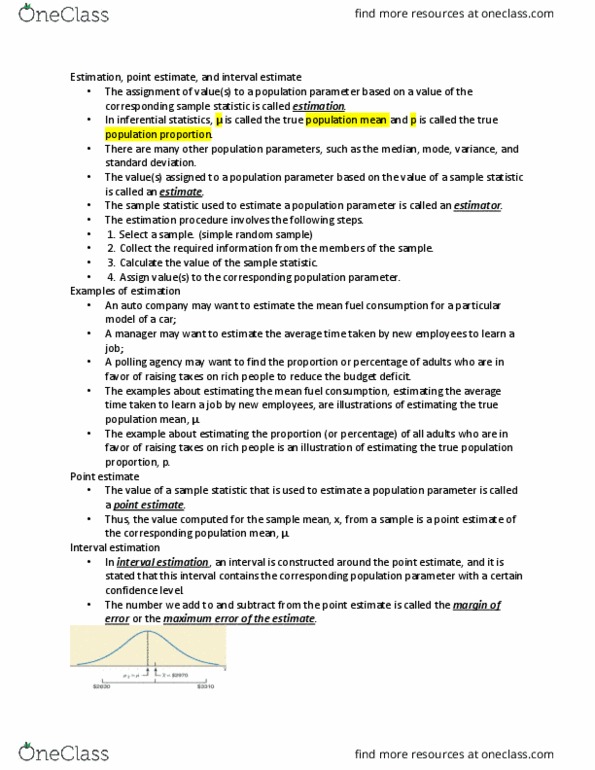
• Level of Confidence – represents the expected proportion of intervals that will obtain the
parameter if a large number of samples is obtained
o Formula = (1 – ) x 100%
o denotes total area under the curve
• How to Denote (confidence interval and alpha)
o ex: CI = 95%
▪ (1 – ) x 100% = 95%
▪ (1 – ) = 0.95
o ex: = 0.05
▪ (1 – ) x 100% = 95%
▪ (1 – ) = 0.95
o A 95% confidence interval ( = 0.05) implies that if 100 different confidence
intervals are constructed each based on a different sample from the same
find more resources at oneclass.com
find more resources at oneclass.com

population, we expect 95 of the intervals to include the parameter and 5 to not
include the parameter
▪
– represents one of the tail areas on the graph
▪ (1 – ) – represents the middle area of the graph being measured
• Constructing a Confidence Interval
o If a random sample of size n is taken from a population a (1 – ) x 100% a
confidence interval for p is given by the quantities:
▪
o If a random sample of size n is taken from a population a (1 – ) x 100% the
margin of error for p^ is given by the quantity:
▪
o ex: obtain a confidence interval for the proportion of registered voters nationwide
who are in favor of the death penalty for persons convicted of murder if 1123
registered voters out of 1783 were in favor.
▪
▪ Interpretation: we are 90% confident that the proportion of registered
voters who are in favor of the death penalty for those convicted of murder
is between 0.61 and 0.65
Objective 3 – Determine the Sample Size Needed to Estimating a Population Proportion Within a
Specified Margin of Error
• The sample size needed for a specified the margin of error and level of confidence in a (1
– ) x 100% is given by the quantity
find more resources at oneclass.com
find more resources at oneclass.com
Document Summary
Chapter 9 estimating the value of a parameter. Interpretation: we are 90% confident that the proportion of registered voters who are in favor of the death penalty for those convicted of murder is between 0. 61 and 0. 65. Objective 3 determine the sample size needed to estimating a population proportion within a. Specified margin of error: the sample size needed for a specified the margin of error and level of confidence in a (1. Objective 3 state properties of a student t-distribution: properties, 1. The t-distribution is different for different degrees of freedom: 2. The t-distribution is centered at 0 and symmetric about 0: 3. The area under the curve is 1: 4. The area under the curve to the right of equals the area under the curve to the left of , which equals 0. 5: 5. As x increases (grows larger), the graph approaches, but never reaches, the horizontal axis: 6.